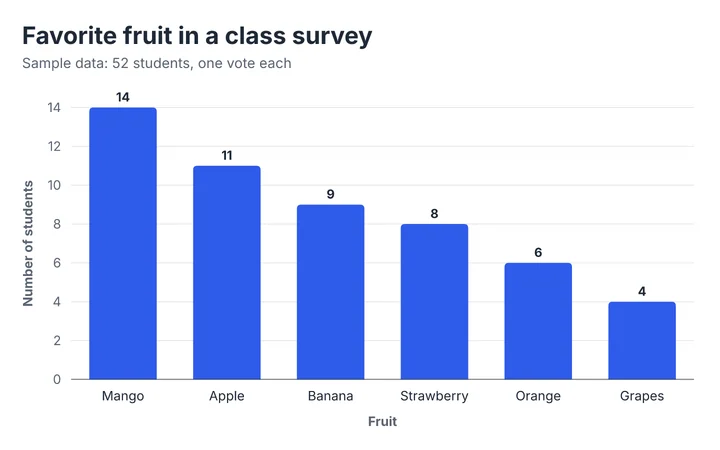
Favorite fruit in a class survey
A single-series bar graph: one bar per category, sorted so the ranking is obvious.
Examples
Each chart below was made with these tools from sample data. Open one in the editor to see the exact numbers and settings, then replace them with your own.
About the data. All numbers on this page are made-up sample data for illustration. They are not real statistics.
A single-series bar graph: one bar per category, sorted so the ranking is obvious.
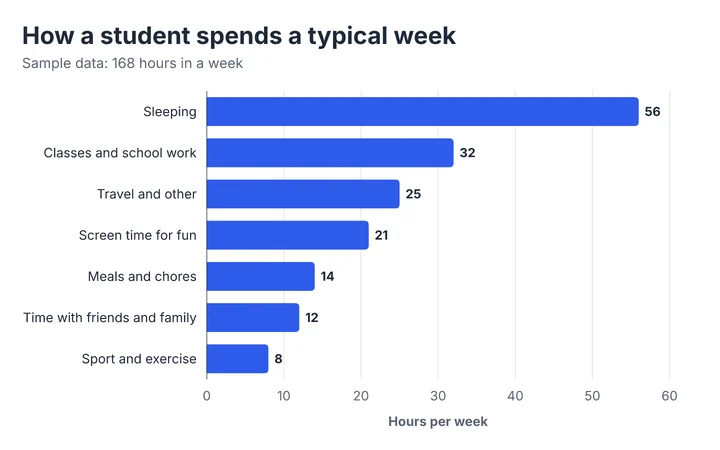
A horizontal bar graph works best when category names are long.
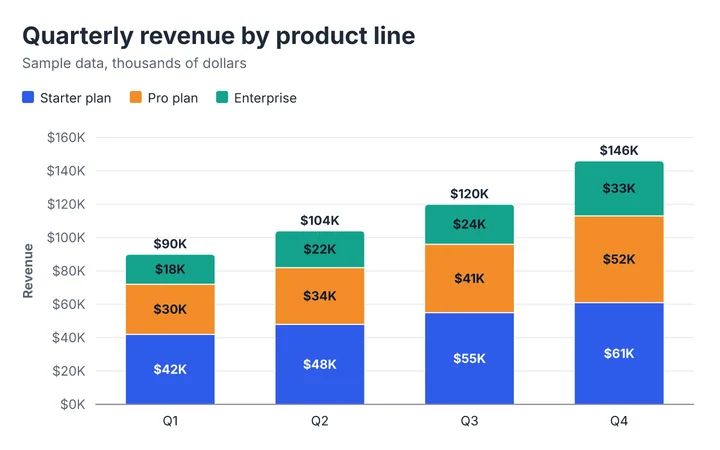
A stacked bar chart shows each total and what it is made of.
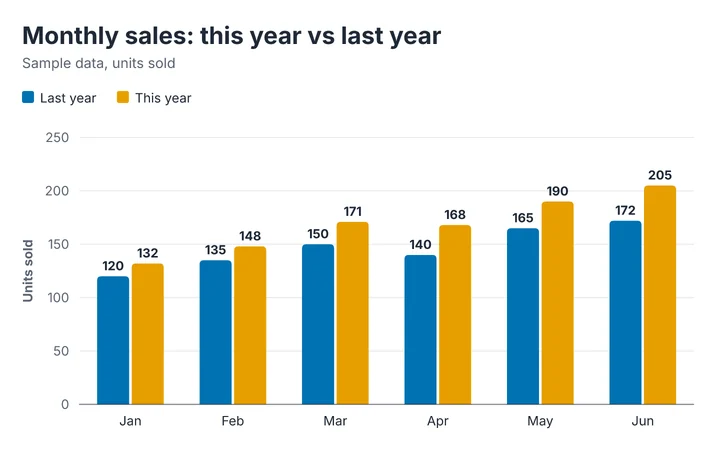
A grouped (double) bar graph puts two series side by side for direct comparison.
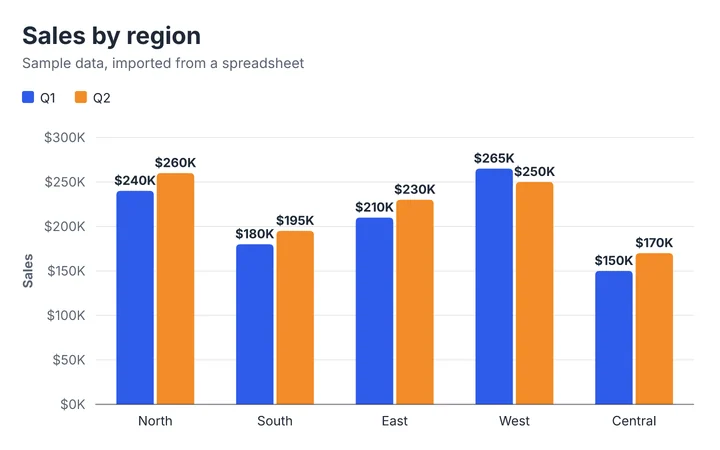
Paste rows from Excel or Google Sheets, or drop a .csv file, and the chart is built for you.
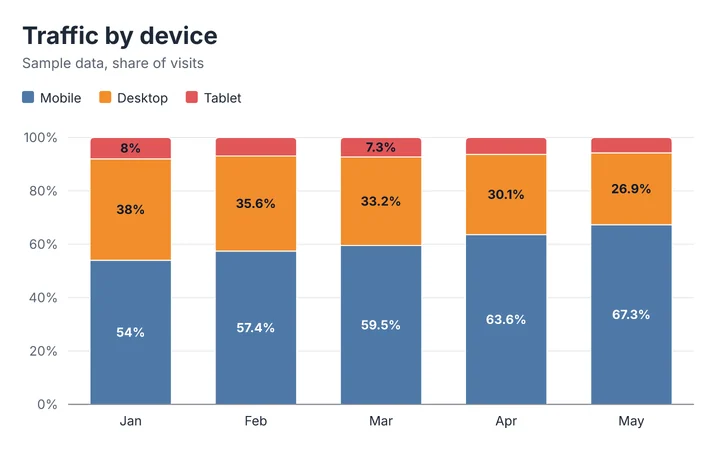
A 100% stacked bar chart compares proportions when totals differ.
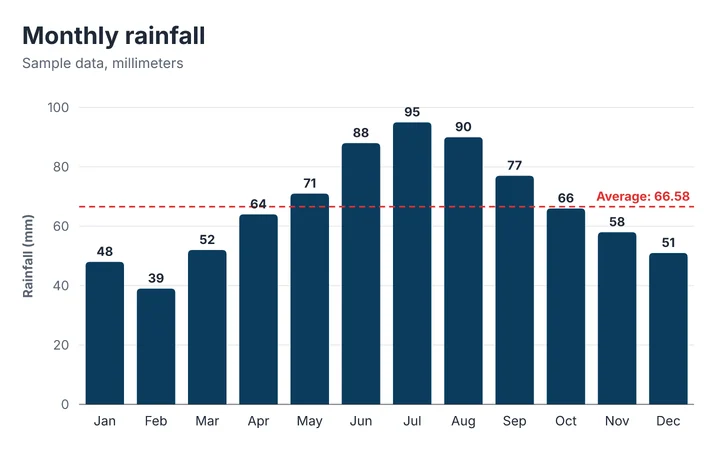
A reference line makes it easy to see which bars are above or below the average.
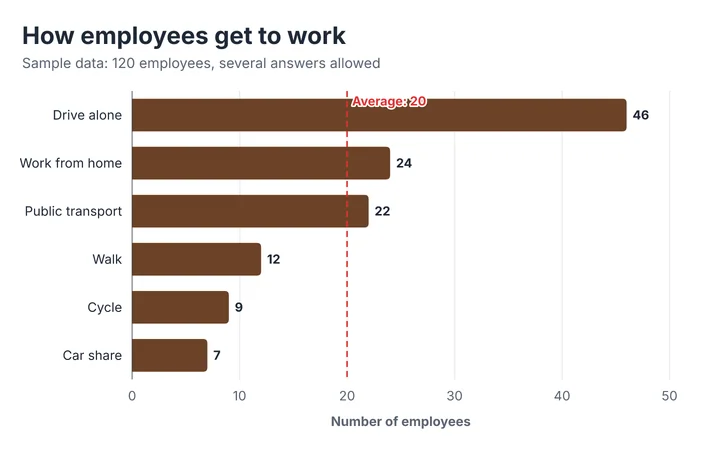
Horizontal bars keep descriptive labels on one line, and an average line shows what is typical.
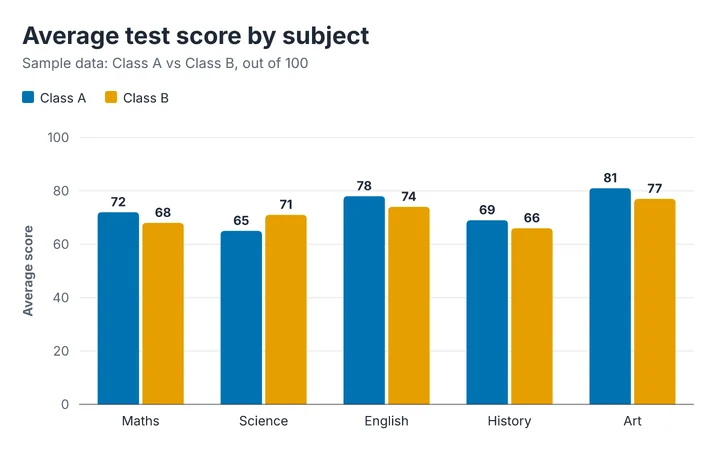
A double bar graph compares two groups across the same categories.
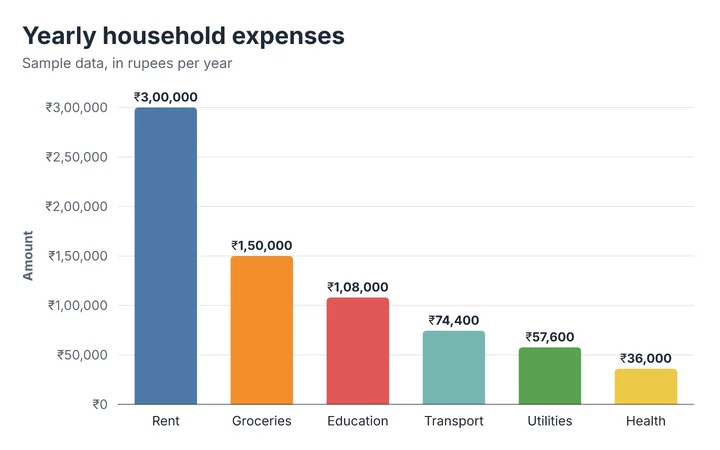
Indian digit grouping (₹3,00,000 rather than ₹300,000) and a rupee prefix, set in the Number format section.
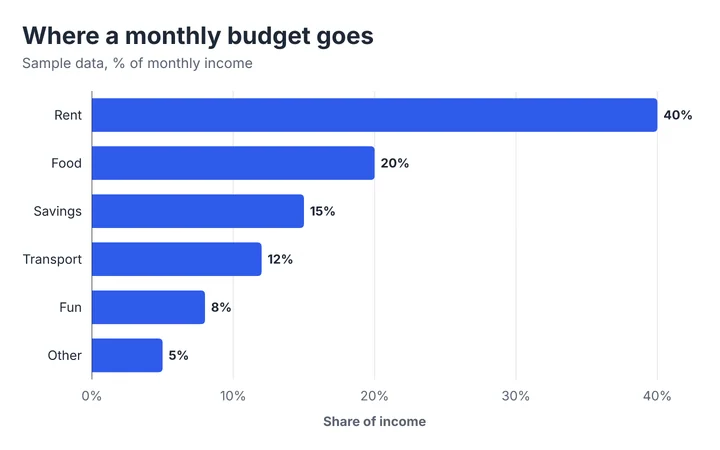
Bars make it easy to rank the categories and compare similar values, which a pie makes hard.
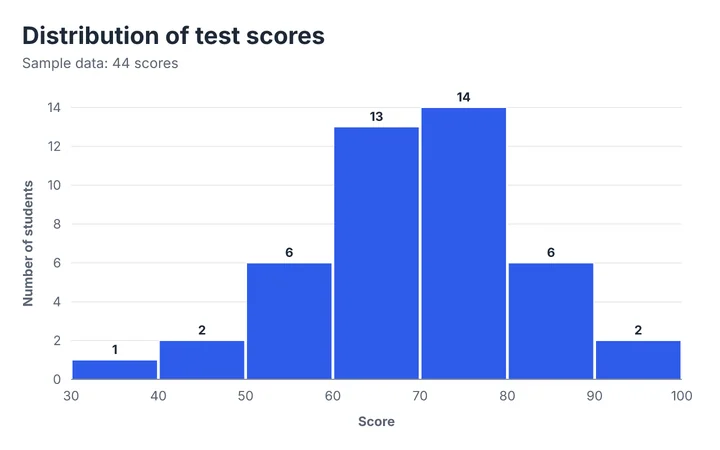
A histogram bins raw numbers to show their shape: center, spread and outliers.
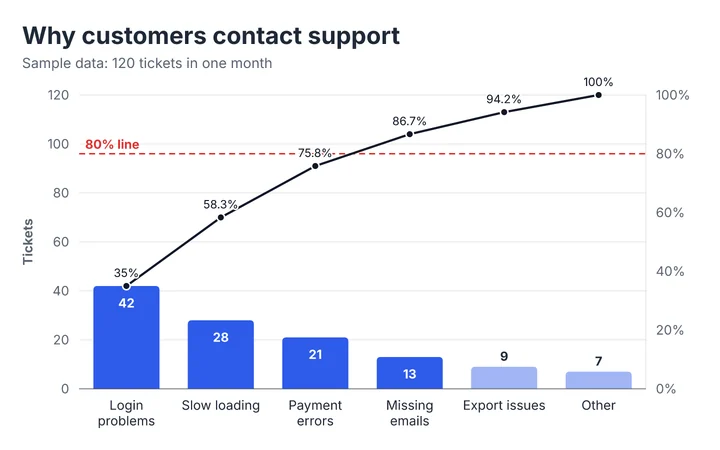
A Pareto chart ranks causes and shows the cumulative share, so you can find the vital few.
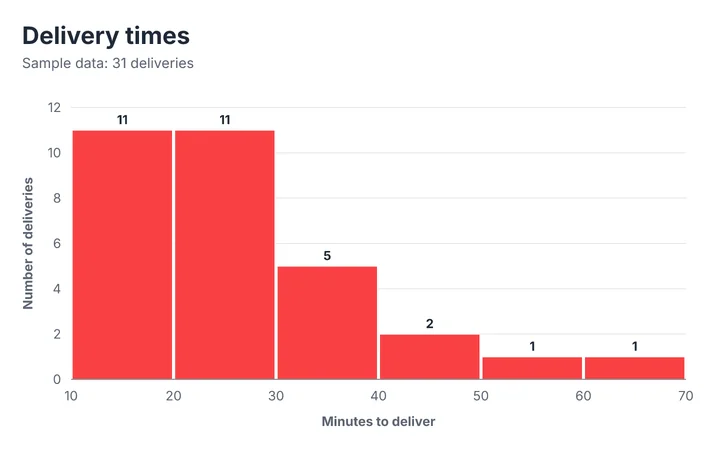
A histogram makes a long tail of slow deliveries visible, which an average would hide.
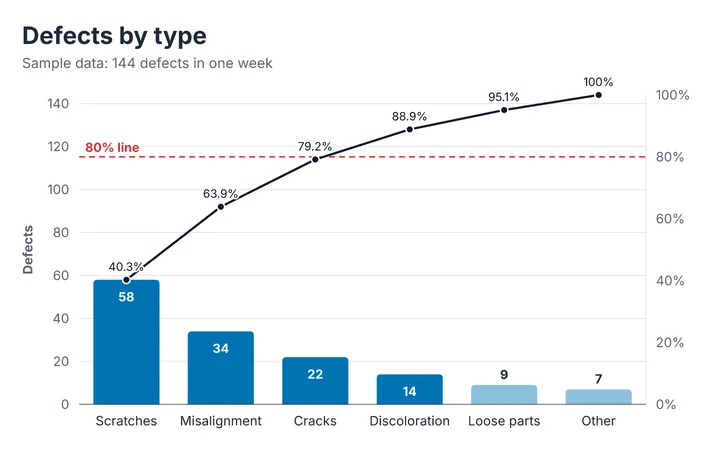
The first three defect types account for about 79% of all defects.
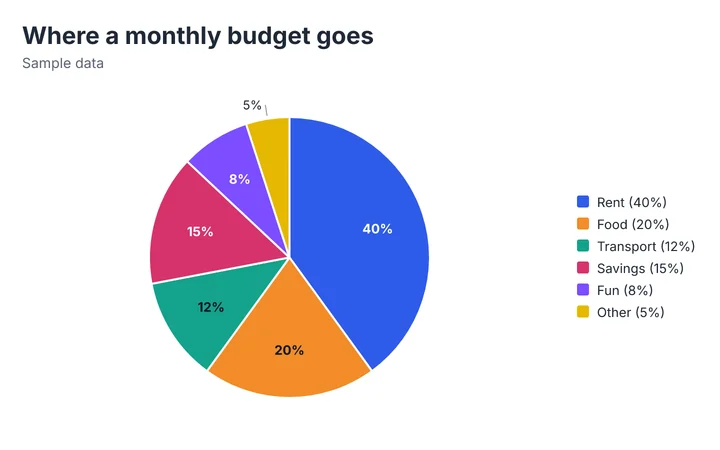
A pie chart shows parts of one whole. Keep it to a handful of slices.
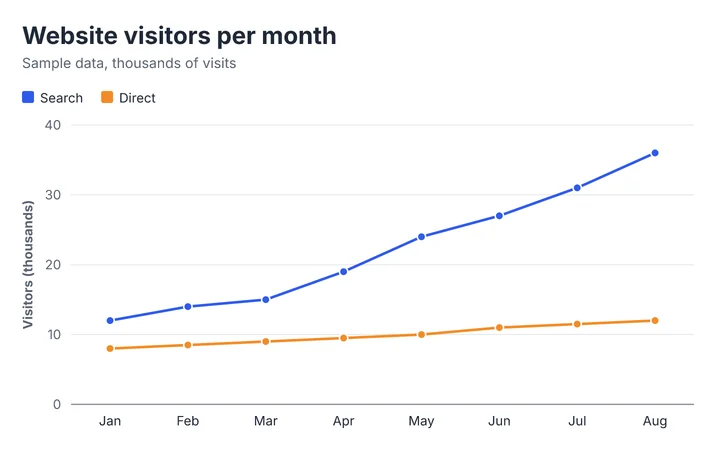
A line graph shows change over an ordered sequence such as months.
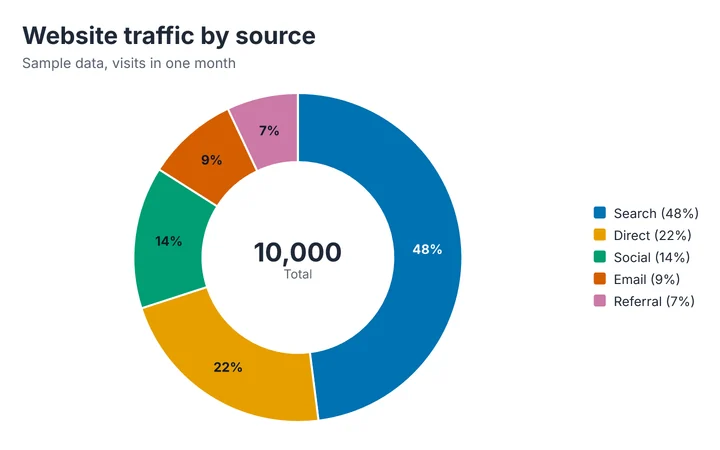
A donut chart puts the total in the middle and keeps the focus on shares.
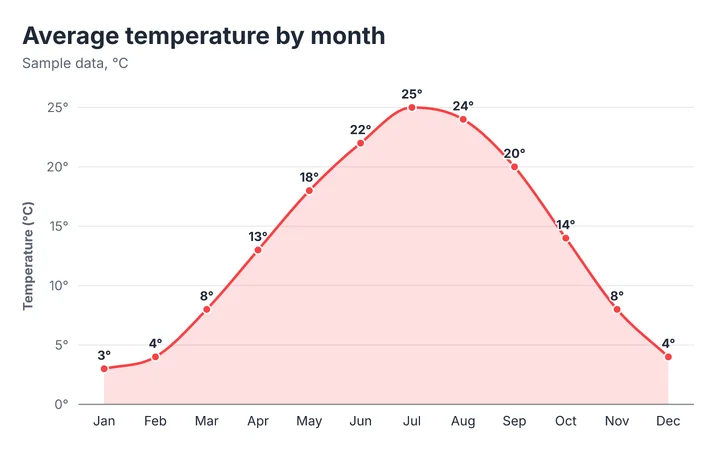
A single smooth line with an area fill shows a seasonal cycle.
Start from the bar graph maker, paste your data, and follow the best-practice checklist before you share it.