CSV to Bar Chart
Turn a CSV file or spreadsheet columns into a bar chart. Paste or drop a file; it never leaves your browser.
- Free, no account
- File never uploaded
- Understands $, %, 1.234,5 and 12,34,567
- No watermark
Import from a spreadsheet or CSV
Accepts .csv, .tsv or .txt files up to 3 MB, with up to 200 rows and 12 series. The first column is used for labels; every other column becomes a series. Excel files (.xlsx) are not read directly: save as CSV first. Files are read in your browser and never uploaded.
| Label | |||
|---|---|---|---|
Tip: click the first cell and paste rows from Excel or Google Sheets. Press Enter to move down.
How to use the csv to bar chart
- Copy your table or pick your file. In Excel or Google Sheets, select the labels and numbers (include the header row if you have one) and copy. Or export the sheet as CSV.
- Paste it or drop the file. Paste into the box under “Import from a spreadsheet or CSV”, or drop the file anywhere on the data panel. You can also click the first cell of the table and paste.
- Check what was read. You will see how many rows and series were loaded and any cells that could not be read as numbers. Fix them in the table; unreadable cells are outlined in red.
- Design the chart. Add a title and axis titles, choose grouped or stacked bars for multiple columns, and pick a palette.
- Download the chart. Save it as PNG, JPG or SVG. Your cleaned-up data can be downloaded back as CSV from the Export tab.
What you get
- Detects the delimiterTab (from a spreadsheet paste), comma, semicolon or pipe, including quoted fields such as "Smith, J".
- Finds the header rowA first row of text, or of years such as 2023 and 2024, is treated as series names. Override it with the “First row is a header” option.
- Reads real-world numbers$1,200, 12%, (500) as −500, 1.234,5, and Indian grouping such as 12,34,567 all become numbers.
- Nothing is uploadedFiles are read by your browser. There is no server step, so a confidential spreadsheet stays on your device.
- Tells you what it skippedText-only columns are skipped and unreadable cells are counted, so you know before you publish.
- Full editor includedEverything in the main bar graph maker: horizontal, grouped, stacked, colors, labels and export.
- Round-trip to CSVDownload the cleaned data back as a CSV from the Export tab.
Examples: data in, chart out
These charts were made with this tool from the sample data described under each one. Open any of them in the editor to see the exact numbers and settings, or browse the full examples gallery.
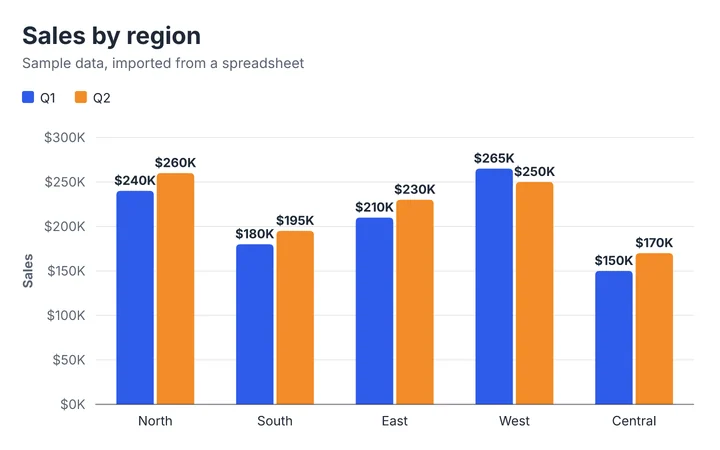
Input: five regions with two quarters of sales copied from a sheet (sample data). The header row became the legend, and the dollar and “K” formats were applied in Number format.
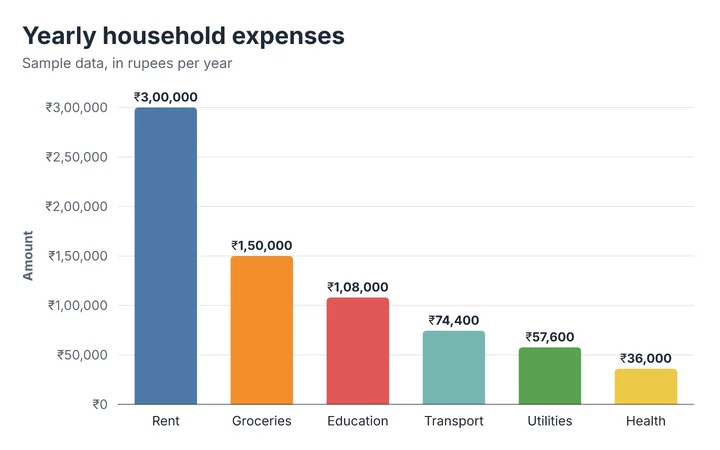
Input: six yearly household expenses (sample data). Settings: Digit grouping › Indian, prefix ₹, color by category, sorted largest first. The top value reads ₹3,00,000, not ₹300,000.
How this csv to bar chart works
Import is a small, predictable set of rules, so you can see why a file was read the way it was.
- The delimiter is chosen from the first lines: tab, then semicolon, comma or pipe, ignoring delimiters inside quotes. Text with no delimiter at all can still be read if every line ends in a number, such as “Apples 12”.
- The first column is the label; every other column that contains at least one number becomes a series. Columns with no numbers are skipped and you are told.
- A header row is assumed when every cell after the first is text, or when every one is a four-digit year between 1800 and 2199. Use the header option to override.
- Numbers may contain currency symbols, percent signs and spaces. Parentheses mean negative. When both “,” and “.” appear, the last one is the decimal mark; a single “1,234” is read as one thousand two hundred thirty-four, and “12,34,567” as Indian grouping.
Limits you should know about
- Excel files (.xlsx, .xls) are not read directly. In Excel choose Save As › CSV, or copy the cells and paste them here.
- Files over 3 MB are rejected. Rows beyond 200 and series beyond 12 are cut.
- A single value such as “1,5” is read as 1.5 (decimal comma). If you meant a list, put a space after each comma.
- Dates are treated as text labels, not as a time axis, so uneven gaps between dates are not drawn to scale.
What happens to your data
Your file is read by your browser using the File API. It is not uploaded, and the chart is drawn locally. The parsed table is autosaved to local storage on this device so you can return to it. See the privacy notes.
Method last reviewed September 30, 2026. See how we build and check our tools.
When to use it
Spreadsheet exports
Sales, survey or analytics exports that need a quick chart for a document.
Google Forms results
Download the responses as CSV and chart a summarized column.
Lab or class data
Measurements entered in a sheet and turned into a graph for a report.
Clean-up and re-export
Paste, fix a few cells, and download the tidy CSV again.
Excel step by step
Prefer to chart inside Excel? The guide covers that too.
Raw numbers, not counts
If you have a list of raw values rather than category totals, use the histogram maker.
Tips and common mistakes
- Aggregate firstThis tool draws the numbers you give it. For 5,000 survey rows, summarize to one number per category (a pivot table) before pasting.
- Keep one header rowMerged cells and multi-line headers do not survive copy and paste. Simplify to one row.
- Remove totals rowsA “Total” row would become another bar. Delete it before importing.
- Use consistent number formatsAvoid mixing “1,5” and “1.5” in one column.
- Check red cellsRed cells in the table did not parse as numbers. Typos such as “12O” (letter O) are common.
- Try the paste box for messy textIt handles quoted commas, semicolon-separated files and “label number” lines.
Frequently asked questions
How do I convert a CSV file to a bar chart?
Open the “Import from a spreadsheet or CSV” section above, choose your .csv file (or drop it onto the data panel), and the chart is built from the first column of labels and the number columns. Then adjust the design and download it.
Is my CSV file uploaded to a server?
No. The file is read by your browser and turned into a chart on your device. Nothing is uploaded.
Can I import an Excel .xlsx file?
Not directly. In Excel choose File › Save As › CSV, or select the cells, copy them, and paste into the paste box or the first table cell.
Which column becomes the labels?
The first column. Every other column that contains numbers becomes a series (a set of bars).
My numbers use commas as decimals. Will that work?
Usually. Values such as 1.234,5 and 12,5 are recognized. A file separated by semicolons (common in European Excel) is detected automatically.
Why were some cells left empty?
They could not be read as numbers, for example “N/A” or a stray letter. The import message counts them, and they are outlined in red in the table so you can correct them.
How many rows can I import?
Up to 200 rows and 12 series. For larger datasets, summarize by category first.
Related chart tools
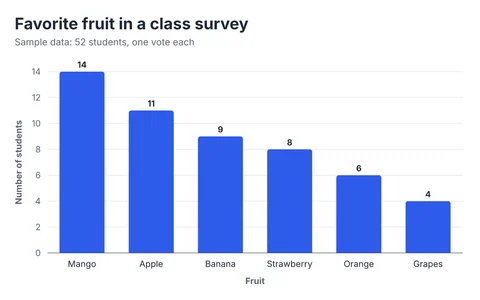
Bar Graph Maker
Vertical, horizontal, grouped and stacked bar graphs from your own data.
Open the tool →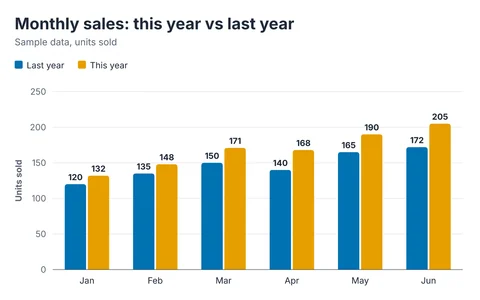
Grouped Bar Chart Maker
Compare two or more series side by side: double and clustered bar graphs.
Open the tool →
Histogram Maker
Paste raw numbers; get bins, a frequency table and summary statistics.
Open the tool →Guides that go with this tool
- How to Make a Bar Graph in Excel and Google SheetsStep-by-step instructions for making a bar graph in Excel and Google Sheets, plus a faster way to turn spreadsheet data into a clean chart image.
- How to Make a Bar Graph, Step by StepLearn how to make a bar graph by hand or online: choose your categories, set a scale that starts at zero, draw the bars, and label everything.