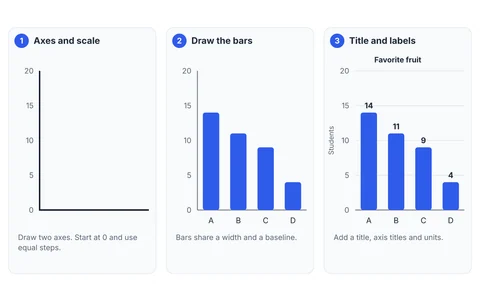
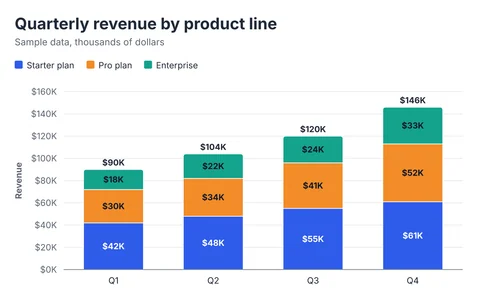
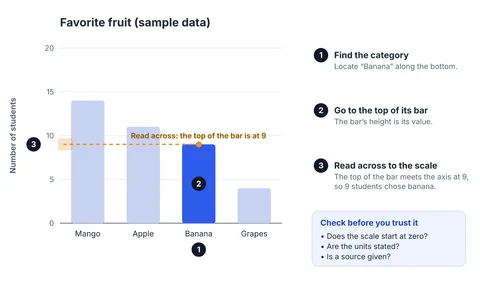
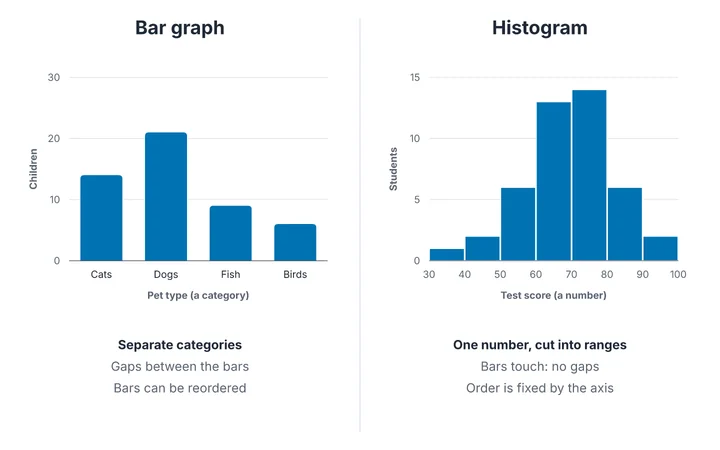
Quick answer: a bar graph compares separate categories, so its bars have gaps and can be reordered. A histogram shows how one continuous number is distributed across ranges (bins), so its bars touch and their order is fixed by the number line. If you can sort the bars any way you like, it is a bar graph. If the x-axis is a number scale, it is a histogram.
The differences at a glance
| Feature | Bar graph | Histogram |
|---|---|---|
| X-axis shows | Categories (pet type, country, month) | A number scale cut into ranges (score, minutes, height) |
| Gaps between bars | Yes | No, the bars touch |
| Order of bars | Can be sorted or rearranged | Fixed: left to right along the number line |
| Bar height shows | The value for that category | How many values fall in that range (or their share) |
| Bar width | Has no meaning; keep it equal | Is the bin width, and matters |
| Data you enter | One number per category | A list of raw numbers; the tool counts them into bins |
When to use a bar graph
Use a bar graph when you already have a number per category: sales by region, votes per candidate, students per favorite fruit. The categories are separate things, and the question is “which is bigger?” Start with the bar graph maker.
When to use a histogram
Use a histogram when you have many measurements of one thing and want to see their shape: test scores for a class, delivery times, heights in a sample. The question is “how are these spread out?”: where is the center, how wide is the spread, is there a long tail or a second peak?
You enter the raw numbers and the tool sorts them into equal-width bins and counts them. Try the histogram maker, which also shows the bin table and summary statistics.
A common confusion
Students are often asked to “make a bar graph” of a frequency table with ranges such as 0–9, 10–19, 20–29. When those ranges are consecutive pieces of a number line, the correct chart is a histogram with no gaps. When the groups are separate categories with no natural order (dogs, cats, fish), it is a bar graph with gaps.
There is also a middle case: something like “age group” or “income band” is a set of ordered ranges. A useful test is whether the ranges are equal in width and run on from one another without gaps. If they are, the underlying data is a continuous number and the touching bars of a histogram are the honest way to draw it. If the groups are uneven or unrelated, use a bar graph.
What to check on each
- Bar graph: the axis starts at zero; the categories are in a sensible order; the bars have equal width.
- Histogram: the bin width is stated or obvious; the bins are equal; the axis starts at zero; there are enough bins to see the shape but not so many that it is noisy. The bin width guide explains how to choose.
Frequently asked questions
Is a histogram a type of bar graph?
It looks like one, and both use bars whose height represents a count or value. But they answer different questions, and the rules differ: histograms have touching bars, equal-width bins and a numeric x-axis. Treat them as separate chart types.
Can I reorder the bars of a histogram?
No. The bars sit along a number line, so their order is fixed. Reordering them would destroy the shape you are trying to see.
Why do histogram bars touch?
Because the bins are consecutive ranges of a continuous number with no gaps between them. A gap would imply a range of values that does not exist.
Which should I use for survey answers?
If the answers are choices (agree, neutral, disagree), use a bar graph. If the answers are numbers, such as ages or ratings from 1 to 100, and you want their distribution, use a histogram.
Unfamiliar term? See the chart and graph glossary, or browse the examples gallery.
Spotted an error or something unclear? Tell us and we will fix it. Sources for factual claims are linked in the text. We say so on the page when something is a rule of thumb rather than a standard.