All tools
Free chart tools
Nine chart makers that run in your browser. Type or paste your data, adjust the design, and download a PNG, JPG or SVG.
Bar graph makers
Five ways to draw bars, from a single series to stacked totals, plus a spreadsheet importer.
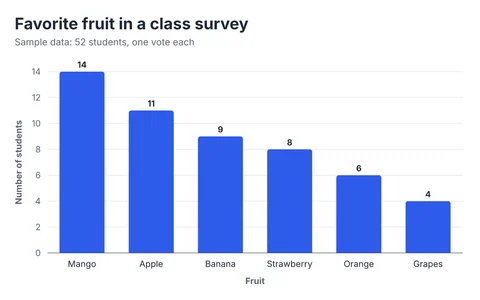
Bar Graph Maker
Vertical, horizontal, grouped and stacked bar graphs from your own data.
Open the tool →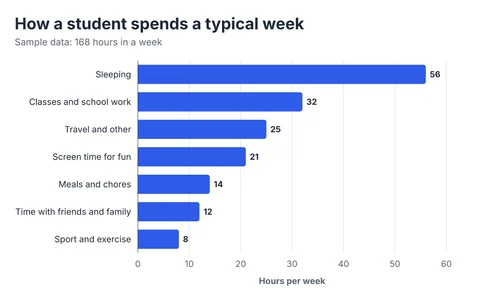
Horizontal Bar Graph Maker
Best for long labels, rankings and survey answers.
Open the tool →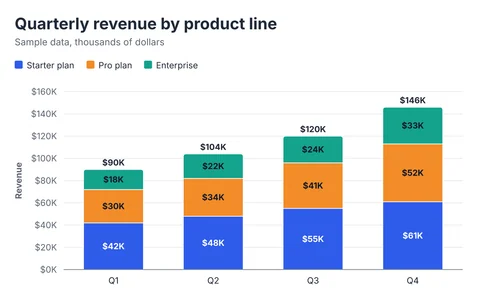
Stacked Bar Chart Maker
Show totals and what they are made of, or switch to 100% proportions.
Open the tool →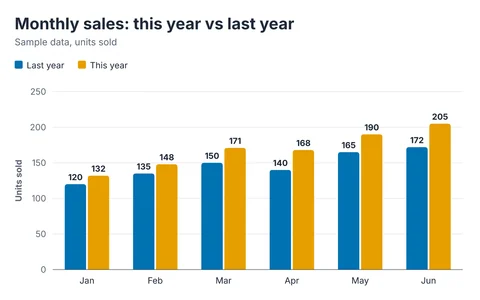
Grouped Bar Chart Maker
Compare two or more series side by side: double and clustered bar graphs.
Open the tool →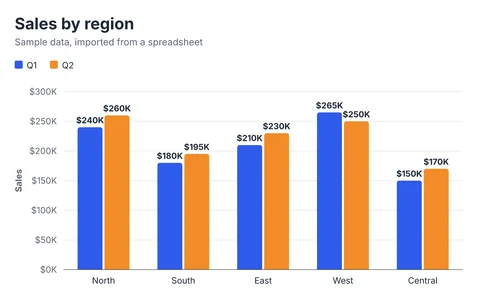
CSV to Bar Chart
Paste from Excel or Google Sheets, or drop a CSV file. Nothing is uploaded.
Open the tool →Other chart types
Charts that pair naturally with bar graphs: distributions, cause ranking, shares and trends.
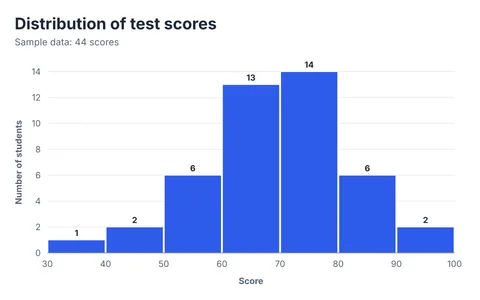
Histogram Maker
Paste raw numbers; get bins, a frequency table and summary statistics.
Open the tool →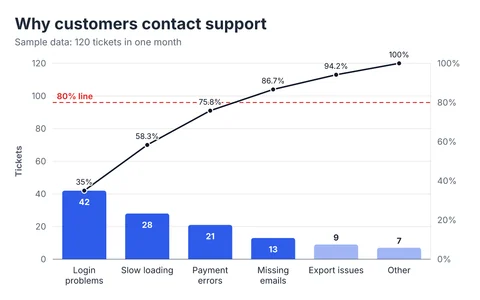
Pareto Chart Maker
Rank causes, add the cumulative line, and find the vital few.
Open the tool →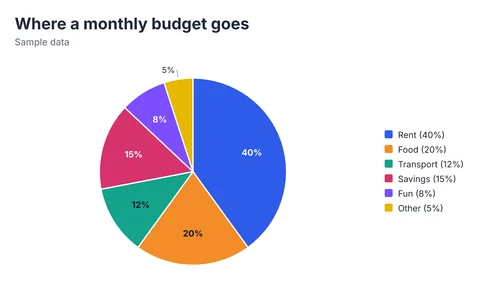
Pie Chart Maker
Pie and donut charts with percent labels and a values legend.
Open the tool →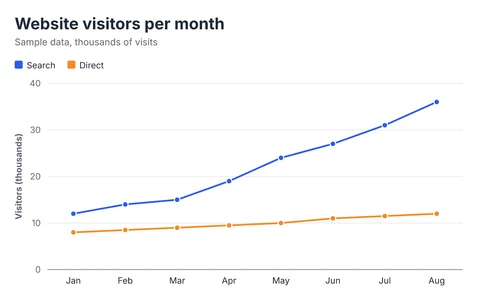
Line Graph Maker
One or many lines over time, with optional smoothing and area fill.
Open the tool →Which chart tool do I need?
| If this describes you | Use |
|---|---|
| I have one number for each category and want to compare them. | Bar Graph Maker |
| My category names are long, or I am ranking many items. | Horizontal Bar Graph Maker |
| I want to compare two or more groups in each category. | Grouped Bar Chart Maker |
| I want to show a total and the parts it is made of. | Stacked Bar Chart Maker |
| My data is in a spreadsheet or CSV file. | CSV to Bar Chart |
| I have a list of raw numbers and want to see how they are spread out. | Histogram Maker |
| I want to find the few causes behind most of a problem. | Pareto Chart Maker |
| I have a few parts of one whole and want to show shares. | Pie Chart Maker |
| I want to show how something changes over time. | Line Graph Maker |
Still deciding between two chart types? These guides compare them: types of bar graphs, bar graph vs histogram and bar chart vs pie chart.
Frequently asked questions
Are all of these tools free?
Yes. Every chart tool on this site is free to use, with no account and no watermark on downloads.
Is my data uploaded anywhere?
No. Charts are drawn in your browser. Your data stays on your device, and your work is autosaved to local storage in that browser only. See the privacy notes.
Which file formats can I download?
PNG and JPG at up to 3× size, SVG for vector use, and your data as CSV. You can also copy the chart as an image.
Which tool should I start with?
If you are not sure, start with the bar graph maker. It covers vertical, horizontal, grouped, stacked and 100% stacked bars in one editor.