Horizontal Bar Graph Maker
Make a horizontal bar graph whose long labels stay readable. It opens sorted and works on your phone.
- Free, no account
- No watermark
- Long labels wrap, not clip
- Data stays in your browser
| Label | ||
|---|---|---|
Tip: click the first cell and paste rows from Excel or Google Sheets. Press Enter to move down.
Import from a spreadsheet or CSV
Accepts .csv, .tsv or .txt files up to 3 MB, with up to 200 rows and 12 series. The first column is used for labels; every other column becomes a series. Excel files (.xlsx) are not read directly: save as CSV first. Files are read in your browser and never uploaded.
How to use the horizontal bar graph maker
- Enter your categories and numbers. Put each answer, name or item in the Label column and its number next to it. Long names are fine.
- Let it rank for you. The example opens sorted largest first, which is what most horizontal charts need. Choose “Keep my order” under Design › Labels, axes and legend if your order is meaningful.
- Name the value axis. On a horizontal chart the value axis runs along the bottom. Give it a title with units, such as “Hours per week”.
- Show exact values if they matter. Value labels sit at the end of each bar. Turn them off for a cleaner look when the gridlines are enough.
- Give many categories room. Pick the Portrait or Square canvas size when you have more than about ten bars, then download a PNG or SVG.
What you get
- Long labels wrapLabels use up to a third of the chart width and wrap onto as many as three lines. Anything longer is shortened with “…”; the full text stays in your table.
- Ranked by defaultBars are sorted largest first, so the reader sees the order without hunting.
- First row on topRows read top to bottom, in the same order as your table.
- Average or target lineAdd a dashed vertical line at the average or at a value you choose, with its own label.
- Graceful when crowdedIf there are more categories than the canvas can show, some labels are skipped instead of overlapping. A taller canvas shows them all.
- Print-friendlyGrayscale palette and hatch patterns for black-and-white printing.
- Alt text and CSVGenerated alt text for accessibility, and your data downloadable as CSV.
Examples: data in, chart out
These charts were made with this tool from the sample data described under each one. Open any of them in the editor to see the exact numbers and settings, or browse the full examples gallery.
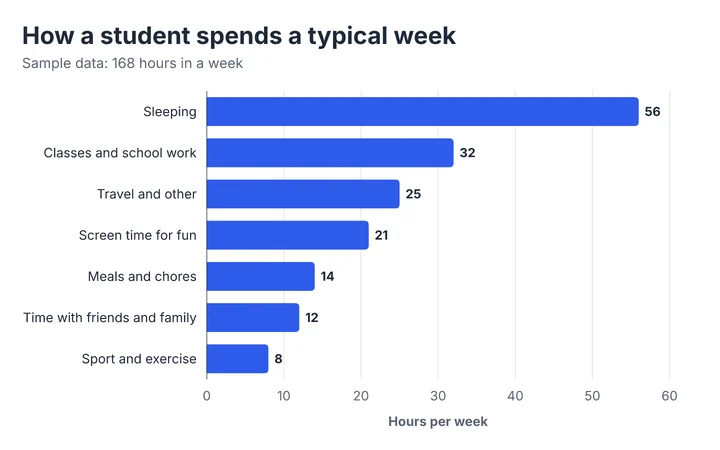
Input: seven activities and the hours a student spends on each in a week (they add up to 168). Settings: horizontal, sorted largest first. Labels such as “Time with friends and family” stay on one line.
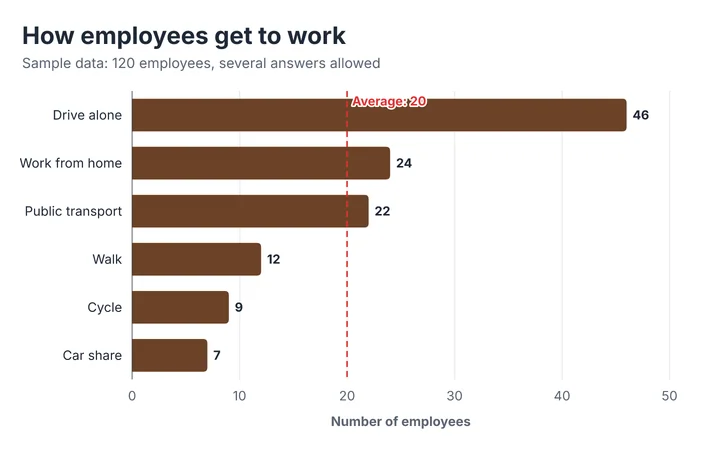
Input: how 120 employees get to work. Settings: horizontal, earth palette, Reference line set to Average. Bars above the dashed line are the most common ways to commute.
How this horizontal bar graph works
This page uses the same chart engine as the main bar graph maker, opened with horizontal bars and sorting turned on.
- The category axis is on the left and the value axis is along the bottom, which is why the axis-title fields are called “Category axis title” and “Value axis title” here.
- Label width is measured with a text-width estimate rather than by the browser, so the preview and the exported image lay out identically.
- Bars start at zero unless you set a minimum. Negative values extend to the left of the zero line.
- Sorting is by value (or by the category total for stacked charts). It never changes your table, only the order on the chart.
Limits you should know about
- Labels longer than about a third of the chart width are shortened with an ellipsis. Widen the canvas or shorten the label to show it in full.
- Up to 200 rows and 12 series. Above roughly 25 bars, consider showing only the top ten and grouping the rest as “Other”.
- One value axis only, and no log scale.
What happens to your data
Your table stays in this browser and is autosaved to local storage on this device. Nothing is sent to a server. Share links contain the data in the link. See the privacy notes.
Method last reviewed September 30, 2026. See how we build and check our tools.
When to use it
Rankings and top-N lists
Best-selling products, most visited pages, largest departments.
Survey answers
Multiple-choice options with wording that would not fit under a vertical bar.
Long or many category names
Country names, course titles, job roles. Learn when this layout beats vertical in the guide.
Mobile-first layouts
Horizontal bars use a phone screen’s height instead of its narrow width.
Ranking causes
If you also need the cumulative percentage, use the Pareto chart maker.
Comparing groups
Two or more series per row? Switch Multiple series to Grouped in the Design tab, or use the grouped tool.
Tips and common mistakes
- Sort largest to smallestReaders scan a ranking from the top. Keep your own order only for sequences such as age bands.
- Keep labels short and parallel“Public transport” beats “Travelling by public transport such as bus or train”. Put detail in the subtitle.
- Do not skip the zeroThe bar’s length is the data. Truncating the axis makes the top bars look far larger than they are.
- Use one colorColor each bar the same unless the color carries meaning. Highlight the one you are discussing.
- Mind the gap widthBars should be thicker than the gaps. If bars look thin, lower “Space between categories”.
- Choose a tall canvas for long listsPortrait (720 × 900) gives each bar room and keeps every label visible.
Frequently asked questions
When should I use a horizontal bar graph instead of a vertical one?
Use horizontal bars when category names are long, when there are more than about seven categories, or when you are ranking items. Vertical bars suit short labels and sequences such as months.
How do I make a horizontal bar graph?
Enter your labels and numbers in the table above. This page already opens with horizontal bars; if you started from the main tool, open Design › Bar layout and choose Direction › Horizontal.
Why is the first row at the top?
So the chart reads like your table, top to bottom. If you turn on sorting, the largest bar goes on top.
How do I sort the bars?
Open Design › Labels, axes and legend › Sort and choose Largest first or Smallest first. Your table order is unchanged.
What happens to very long category names?
They wrap onto up to three lines. If they are still too long they end with an ellipsis on the chart. Widen the canvas under Size and style to give them more room.
Can I add a target line?
Yes. Under Reference line choose Average, or Custom value and type your target. A dashed vertical line and label are drawn.
Can I download a horizontal bar graph as SVG?
Yes. Open the Export tab and choose SVG. The font is embedded so it looks the same in other programs that support it.
Related chart tools
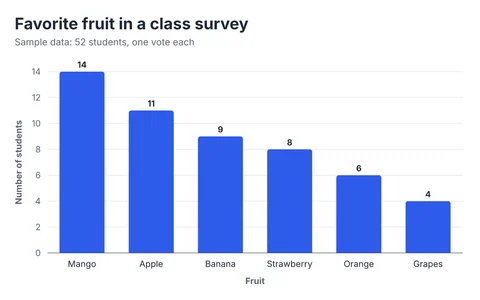
Bar Graph Maker
Vertical, horizontal, grouped and stacked bar graphs from your own data.
Open the tool →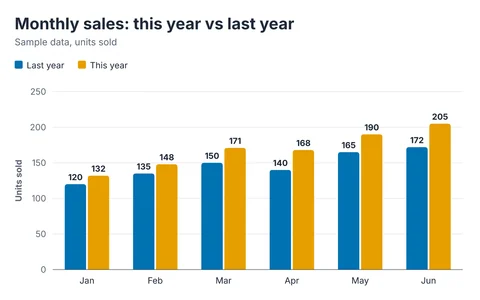
Grouped Bar Chart Maker
Compare two or more series side by side: double and clustered bar graphs.
Open the tool →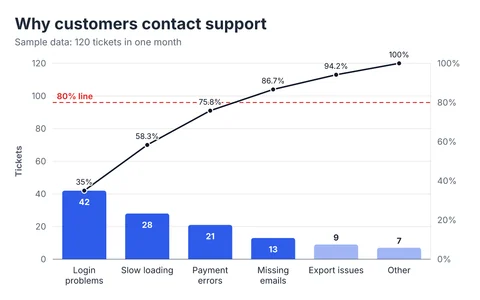
Pareto Chart Maker
Rank causes, add the cumulative line, and find the vital few.
Open the tool →Guides that go with this tool
- Types of Bar Graphs and When to Use EachVertical, horizontal, grouped, stacked and 100% stacked bar graphs explained with examples, what each is best for, and the mistakes to avoid.
- Bar Graph Best Practices: 10 Rules for Clear ChartsTen practical rules for bar graphs that people read correctly: start at zero, sort bars, limit categories, use color carefully, and make charts accessible.