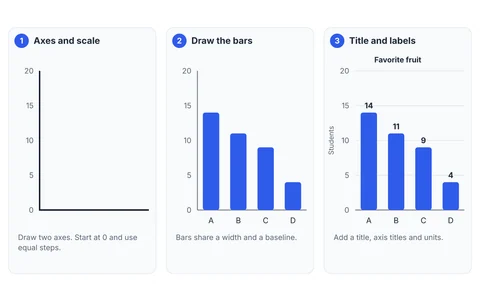
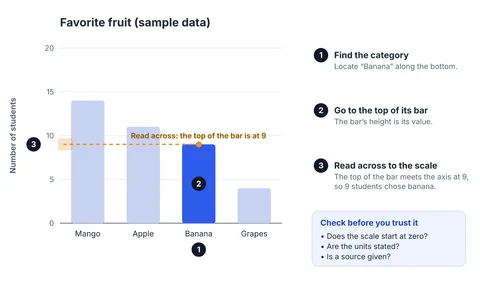
Quick answer: there are five common types of bar graph. Vertical bars suit short labels and sequences like months. Horizontal bars suit long labels and rankings. Grouped (clustered or double) bars compare two or more series side by side. Stacked bars show a total and its parts. 100% stacked bars compare proportions when totals differ. Pick the one that answers your reader’s question most directly.
At a glance
| Type | Best for | Watch out for |
|---|---|---|
| Vertical | One number per category; short labels; sequences (months) | Long labels get cramped |
| Horizontal | Long labels; rankings; many categories | Reading order is top to bottom, so sort deliberately |
| Grouped | Comparing 2 to 4 series within each category | Too many series make a “picket fence” |
| Stacked | A total and what it is made of | Only the bottom segment shares a baseline, so middle segments are hard to compare |
| 100% stacked | Comparing shares when totals differ | Hides the totals; say so if they matter |
Vertical bar graph
The default, and the one most people mean by “bar graph”. Categories run along the bottom and values up the side.
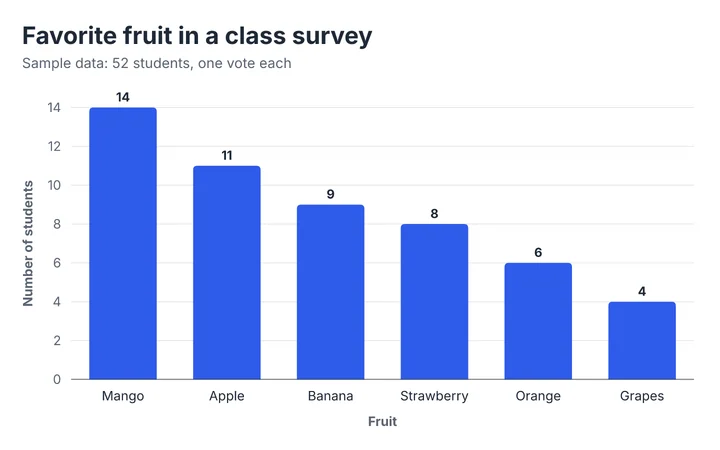
Use it when category names are short and few. It is also the natural choice when categories have a left-to-right order, such as months or age groups. In Excel, this type is called a column chart.
Horizontal bar graph
The same idea turned on its side, with categories down the left and values along the bottom.
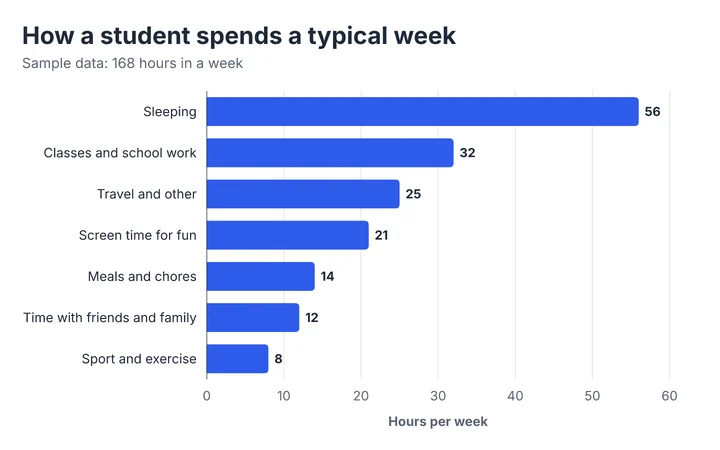
Choose it when labels are long (survey answers, job titles, country names), when you have more than about seven categories, or when the point is a ranking. Sort the bars so the largest is at the top. Read more in the horizontal bar graph maker page.
Grouped bar graph (clustered, double)
Two or more bars per category, one for each series, so you can compare series inside each category. A double bar graph is simply a grouped bar graph with exactly two series.
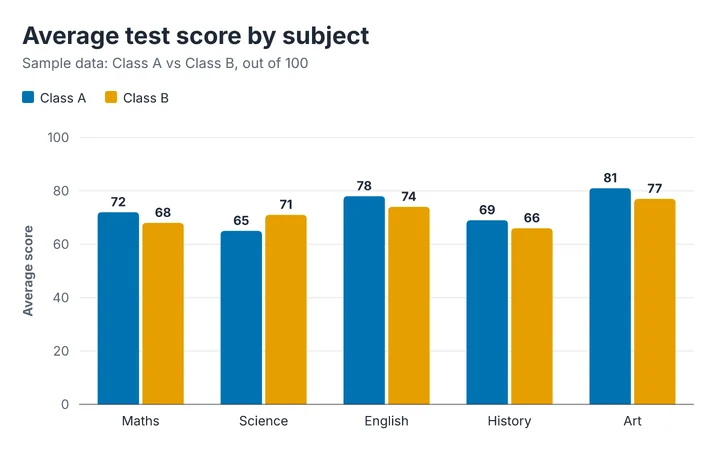
Use it to compare this year with last year, two groups, or before and after. Keep to two to four series. Choose colors that are easy to tell apart, and keep the order of the series the same in every group. The grouped bar chart maker opens with a color-blind-safe palette.
Stacked bar graph
Each bar is split into segments that add up to the bar’s total.
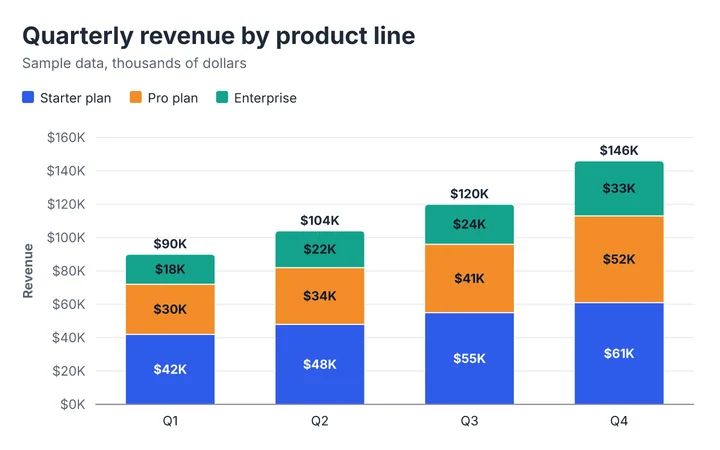
Use it when the total matters and you also want to show the composition. Put the series you care about most at the bottom, where it shares a baseline and can be compared precisely. Limit segments to about five. The stacked bar chart maker writes the total above each stack.
100% stacked bar graph
Every bar is scaled to the same full height, so each segment shows a share.
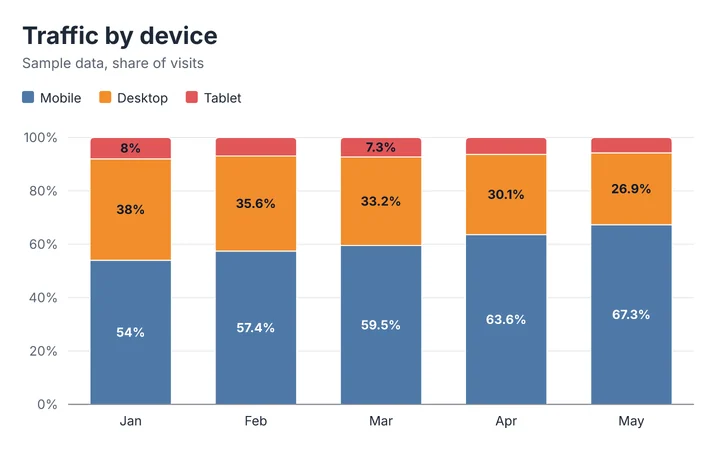
Use it when totals differ but the story is the mix, such as how the share of mobile visits changes month to month. Because total heights are hidden, mention the totals in the subtitle if they matter.
How to choose
Ask what your reader needs to compare:
- One number per category? Vertical or horizontal bars.
- Two or more series, compared with each other? Grouped bars.
- A total and its parts? Stacked bars.
- Shares, not totals? 100% stacked bars (or a pie chart if it is one whole).
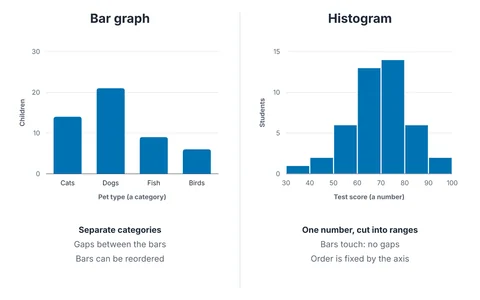
- A number split into ranges? Not a bar graph: use a histogram.
All of these types are available in the bar graph maker, and you can switch between them without re-entering your data.
Unfamiliar term? See the chart and graph glossary, or browse the examples gallery.
Spotted an error or something unclear? Tell us and we will fix it. Sources for factual claims are linked in the text. We say so on the page when something is a rule of thumb rather than a standard.