Learn
Bar graph and chart guides
Short, practical guides with worked examples. Each one links to a free tool so you can try the idea on your own data.
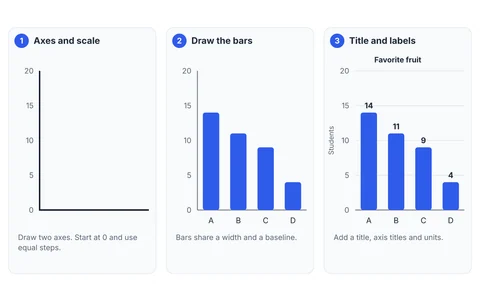
How to Make a Bar Graph, Step by Step
Learn how to make a bar graph by hand or online: choose your categories, set a scale that starts at zero, draw the bars, and label everything.
Read the guide →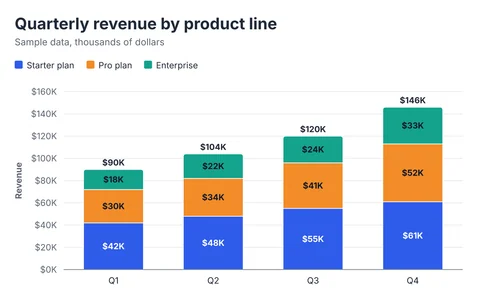
Types of Bar Graphs and When to Use Each
Vertical, horizontal, grouped, stacked and 100% stacked bar graphs explained with examples, what each is best for, and the mistakes to avoid.
Read the guide →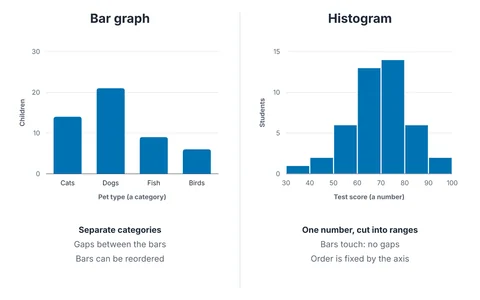
Bar Graph vs Histogram: What's the Difference?
A bar graph compares categories; a histogram shows how one number is distributed across ranges. See the differences with examples and how to choose.
Read the guide →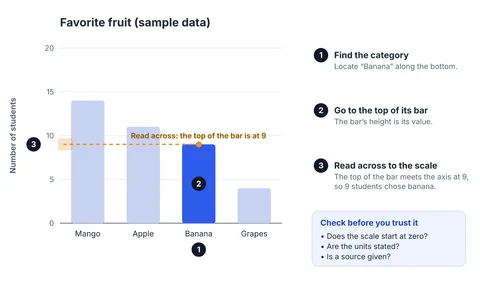
How to Read a Bar Graph
Learn to read a bar graph in four steps, from the title and axes to the bars, and how to spot a misleading one. Includes a worked example with answers.
Read the guide →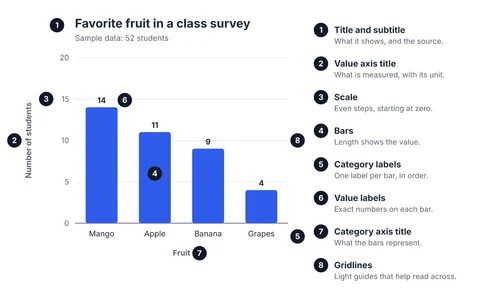
Bar Graph Best Practices: 10 Rules for Clear Charts
Ten practical rules for bar graphs that people read correctly: start at zero, sort bars, limit categories, use color carefully, and make charts accessible.
Read the guide →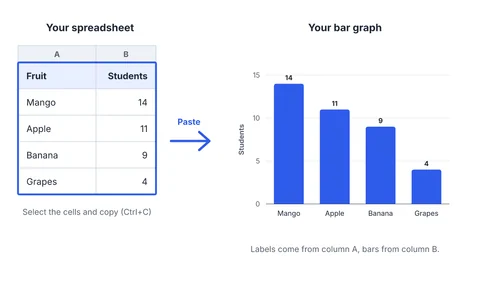
How to Make a Bar Graph in Excel and Google Sheets
Step-by-step instructions for making a bar graph in Excel and Google Sheets, plus a faster way to turn spreadsheet data into a clean chart image.
Read the guide →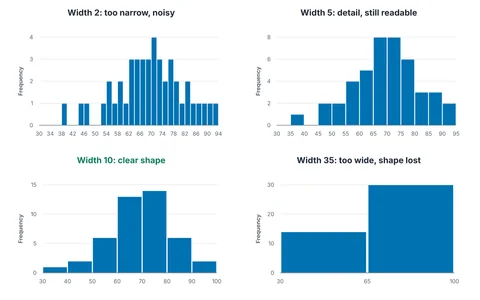
How to Choose a Histogram Bin Width
How many bins should a histogram have? Compare Sturges, square-root, Scott and Freedman–Diaconis rules, with formulas and a worked example you can check.
Read the guide →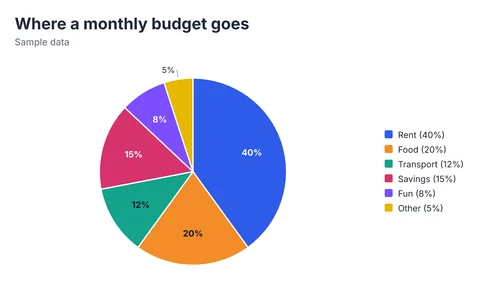
Bar Chart vs Pie Chart: Which One Should You Use?
When to use a pie chart and when a bar chart is clearer: the same data drawn both ways, why bars are easier to read, and simple rules for choosing.
Read the guide →Where to start
- New to bar graphs? Start with how to make a bar graph and how to read one.
- Choosing a chart? Compare types of bar graphs and bar vs pie.
- Working with numbers? See bar graph vs histogram and choosing a bin width.
- Using a spreadsheet? Follow bar graphs in Excel and Google Sheets.