Pareto Chart Maker
Make a Pareto chart: sorted bars, a cumulative percentage line and a threshold, so the vital few stand out.
- Free, no account
- Sorts for you
- Both axes aligned to the total
- Data stays in your browser
| Label | ||
|---|---|---|
Tip: click the first cell and paste rows from Excel or Google Sheets. Press Enter to move down. This chart type uses one column of values.
Import from a spreadsheet or CSV
Accepts .csv, .tsv or .txt files up to 3 MB, with up to 200 rows and 12 series. The first column is used for labels; every other column becomes a series. Excel files (.xlsx) are not read directly: save as CSV first. Files are read in your browser and never uploaded.
How to use the pareto chart maker
- List your categories and counts. Enter each cause, defect type or reason in the Label column and how often it happened (or its cost) next to it. Order does not matter; the chart sorts them.
- Read the cumulative line. The black line shows the running share of the total. Where it crosses the red threshold line, you have found the “vital few”.
- Set your threshold. The classic threshold is 80%. Change it under Design › Pareto settings if your team uses another cut-off, such as 70% or 90%.
- Merge the tail. If you have many tiny categories, combine them into “Other” so the chart stays readable. “Other” is drawn where it falls, in sorted order.
- Label and export. Add a title that states the finding (“Three defect types cause 79% of defects”), then download a PNG or SVG.
What you get
- Sorted automaticallyCategories are ordered from largest to smallest, whatever order you typed them in.
- Both axes alignedThe left axis runs from 0 to the total, and the right axis from 0% to 100%, so the cumulative line meets the top of the first bar correctly.
- Threshold lineA dashed line marks your chosen cumulative percentage. Default 80%.
- Vital few highlightedBars up to and including the first one that reaches the threshold keep the full color; the rest are shaded lighter.
- Cumulative percentages labeledEach point on the line shows its running percentage when there is room.
- Print-friendlyUse patterns and grayscale for a black-and-white printout.
- Alt textGenerated text states how many categories reach the threshold and what share they represent.
Examples: data in, chart out
These charts were made with this tool from the sample data described under each one. Open any of them in the editor to see the exact numbers and settings, or browse the full examples gallery.
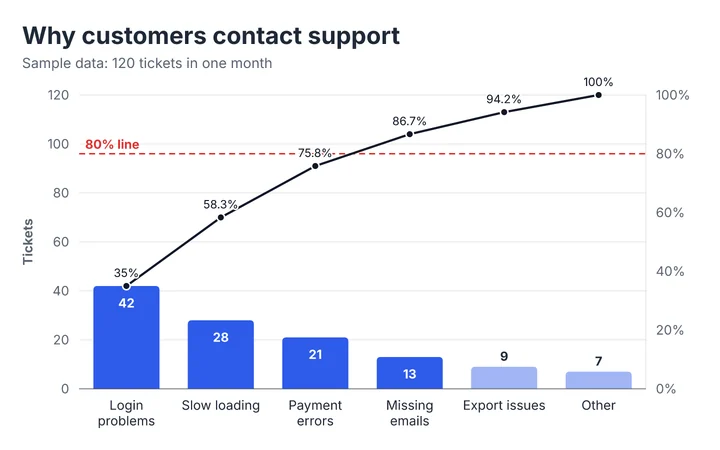
Input: 120 tickets in six causes (sample data). The first four causes reach 86.7% of tickets, and the first three reach 75.8%, so the 80% line is crossed at the fourth bar.
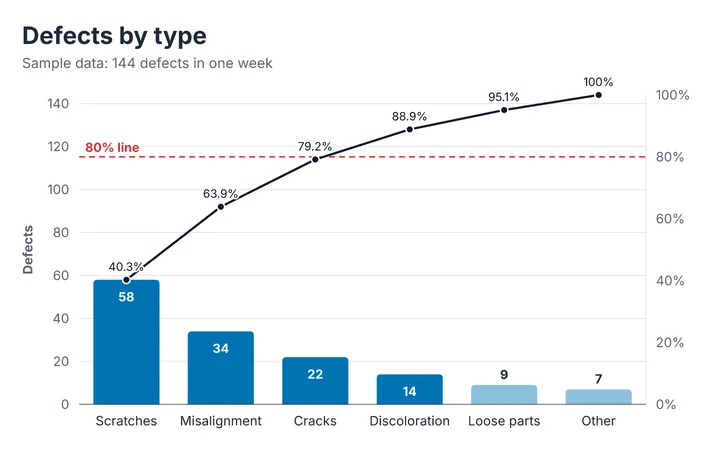
Input: 144 defects in six types (sample data). Scratches, misalignment and cracks account for about 79% of defects, so those three are where fixes would pay off first.
How this pareto chart maker works
A Pareto chart combines a sorted bar chart with a cumulative line, and is used in quality management to prioritize causes.
- Categories are sorted by value, descending. Only the first series (column) is used. Negative and empty values are treated as zero.
- The cumulative percentage at each category is the running total divided by the grand total, times 100.
- The left axis is fixed at 0 to the total, so the cumulative line’s 100% aligns with the top of the left axis. This is the standard construction.
- The “vital few” are the bars up to and including the first category whose cumulative percentage reaches your threshold.
Limits you should know about
- The 80/20 idea is a rule of thumb, not a law. The chart shows what your data says; it does not prove a cause.
- One series only. For comparing several series, use a grouped bar chart.
- Up to 200 categories, though a Pareto chart is most useful with fewer than about a dozen.
- Values should be counts or costs (things that add up). Averages or rates cannot be accumulated meaningfully.
What happens to your data
The chart is drawn in your browser. Your data is autosaved to local storage on this device only and is never uploaded. See the privacy notes.
Method last reviewed September 30, 2026. See how we build and check our tools.
When to use it
Quality and defects
Find the defect types worth fixing first.
Customer support
Rank ticket causes or complaint topics.
Process improvement
Prioritize delays, errors or rework by count or cost.
Cost analysis
See which cost items make up most of a budget.
Just ranking, no cumulative line?
A sorted horizontal bar graph is simpler.
Chart design basics
Rules that apply to every bar-based chart.
Tips and common mistakes
- Count things that add upIncidents, defects, hours and dollars can be accumulated. Percentages and averages cannot.
- Keep the “Other” bar honestIt can be larger than some named bars. If it is your biggest category, your categories are too narrow.
- Put the finding in the title“Three causes drive 79% of defects” tells the reader what to notice.
- Agree the threshold before you lookChoosing 80% after seeing the data invites cherry-picking.
- Use cost, not just count, if you canThe most frequent problem is not always the most expensive one.
- Re-check after changesMake a new chart after improvements to see whether the pattern has shifted.
Frequently asked questions
What is a Pareto chart?
A Pareto chart is a bar chart sorted from largest to smallest with a line showing the cumulative percentage. It highlights the few categories that account for most of the total.
How do I make a Pareto chart?
Enter each category and its count or cost in the table above. The tool sorts them, draws the bars and the cumulative line, and marks your threshold. Then export it as an image.
What is the 80/20 rule in a Pareto chart?
It is the rule of thumb that roughly 80% of effects come from 20% of causes. Real data rarely matches it exactly, which is why the threshold is adjustable and the chart shows the actual numbers.
Why do the axes go up to the total?
So the cumulative line and the bars share one scale. The left axis runs from 0 to the grand total and the right axis from 0% to 100%, which makes the line start at the top of the first bar and end at 100%.
Can I change the 80% line?
Yes. Open Design › Pareto settings and type a threshold between 1 and 99. The highlighted bars update to match.
Do I need to sort my data first?
No. The chart sorts categories from largest to smallest for you.
Can I use more than one column?
No, a Pareto chart uses a single column of values. If you paste several columns, only the first is used.
Related chart tools
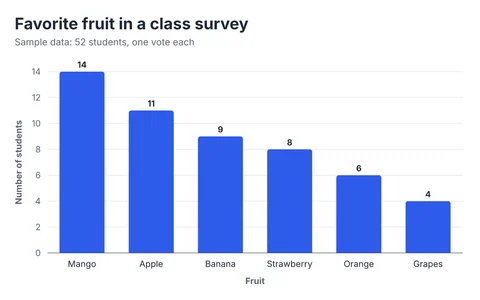
Bar Graph Maker
Vertical, horizontal, grouped and stacked bar graphs from your own data.
Open the tool →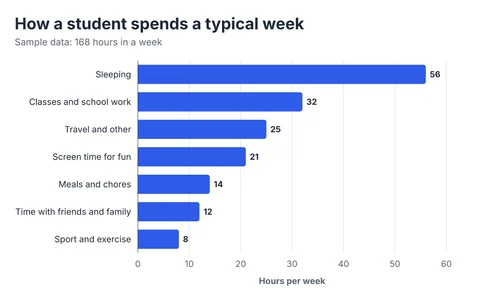
Horizontal Bar Graph Maker
Best for long labels, rankings and survey answers.
Open the tool →
Histogram Maker
Paste raw numbers; get bins, a frequency table and summary statistics.
Open the tool →Guides that go with this tool
- Bar Graph Best Practices: 10 Rules for Clear ChartsTen practical rules for bar graphs that people read correctly: start at zero, sort bars, limit categories, use color carefully, and make charts accessible.
- Types of Bar Graphs and When to Use EachVertical, horizontal, grouped, stacked and 100% stacked bar graphs explained with examples, what each is best for, and the mistakes to avoid.