Quick answer: to make a bar graph, list your categories and one number for each. Draw a horizontal axis for the categories and a vertical axis for the values, starting at zero. Choose an even scale that reaches your largest value. Draw one bar per category, all the same width. Then add a title, axis titles and units. You can do this on paper, or in seconds with the free bar graph maker.
What a bar graph shows
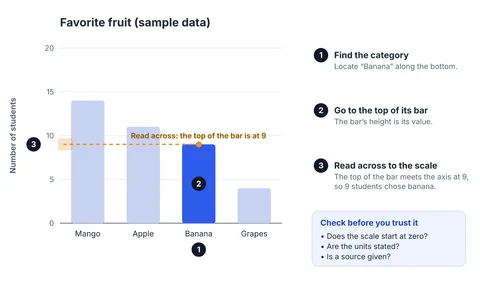
A bar graph compares a number across separate categories. Each bar’s length is proportional to its value, so readers can compare quantities at a glance: which is biggest, which is smallest, and by how much.
Use a bar graph when you have categories (fruit types, countries, months) and one number for each (a count, a total, an average). Two nearby cases need a different chart:
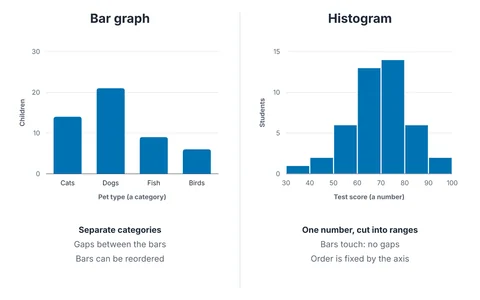
- One continuous number split into ranges, such as test scores, is a histogram.
- A few parts of one whole are sometimes better as a pie chart, though a bar graph usually reads more accurately.
What you need before you start
You need three things: a list of categories, one number for each, and the unit and source of those numbers. Here is the sample data we will use, the results of a class survey in which each of 52 students picked one favorite fruit.
| Fruit | Students |
|---|---|
| Mango | 14 |
| Apple | 11 |
| Banana | 9 |
| Strawberry | 8 |
| Orange | 6 |
| Grapes | 4 |
The numbers add up to 52, which is a useful sanity check: if your categories are meant to cover everyone, the total should match.
How to make a bar graph by hand
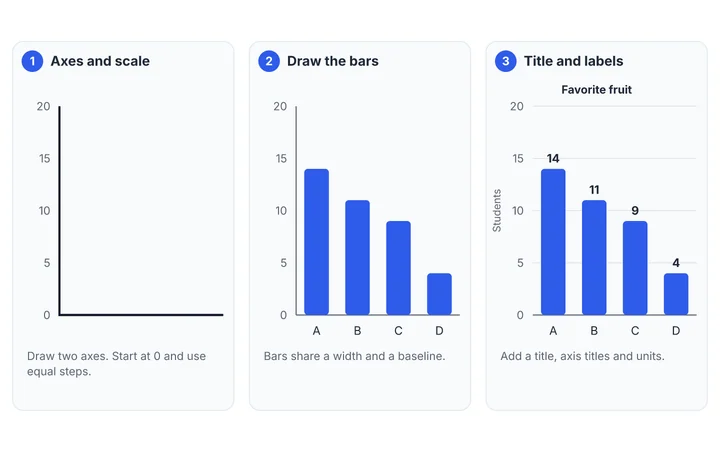
- Draw the axes. Draw an L shape. The horizontal line (the x-axis) will hold the categories. The vertical line (the y-axis) will hold the values.
- Choose the scale. The y-axis must reach your largest value, which is 14 here. Pick steps that are easy to count in, such as 2 or 5, and start at 0. A scale of 0, 2, 4 … 14 works well. Mark the steps evenly.
- Space out the categories. Mark equal spaces along the x-axis, one per category, and write each name underneath.
- Draw the bars. Draw one bar per category from the baseline up to its value. Make every bar the same width, with the same gap between bars.
- Add the words. Write a title that says what the graph shows, label each axis (with the unit, such as “Number of students”), and cite the source.
- Check it. Does each bar reach the right value on the scale? Does the graph start at zero? Could someone who has not seen your data understand it?
Choosing a step size. Divide your largest value by about five, then round to the nearest 1, 2 or 5 (times 10, 100 and so on). For a maximum of 14, 14 ÷ 5 = 2.8, which rounds to 2. That gives the tick marks 0, 2, 4 … 14.
How to make a bar graph online
Doing it on a computer takes about a minute and gives you a file you can drop into a document or slide.
- Open the bar graph maker.
- Type your data into the table, or copy the cells from a spreadsheet and paste them into the first cell.
- Add a title, axis titles and a source in the Design tab.
- Download a PNG, JPG or SVG from the Export tab, or copy the image to your clipboard.
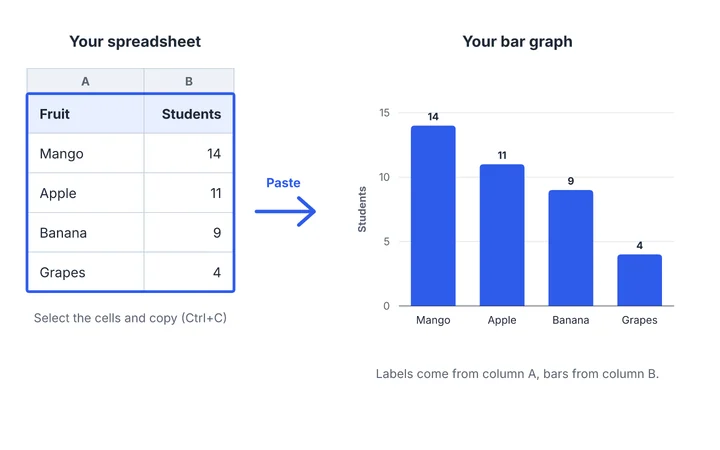
If your numbers are already in Excel or Google Sheets, the Excel guide shows both routes: charting inside the spreadsheet, and pasting into the maker.
The finished graph
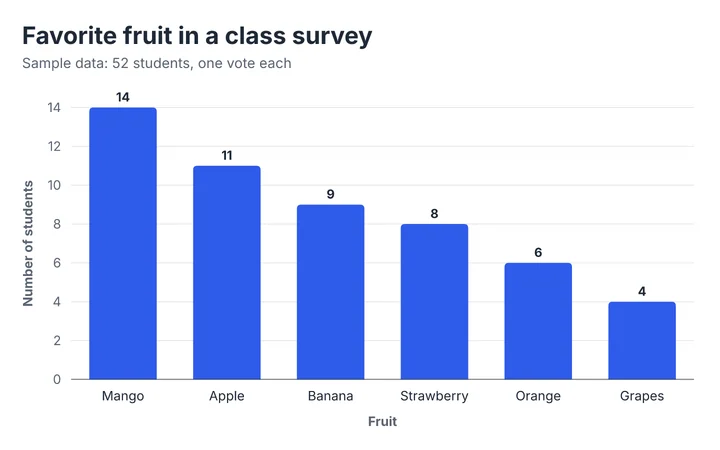
What does it show? Mango is the most popular, with 14 of 52 students (about 27%), and grapes are the least popular, with 4. Sorting the bars from largest to smallest makes that ranking obvious without reading a single number.
Common mistakes to avoid
- Not starting at zero. Bar length is the message. If the axis starts at 90, a bar for 95 looks several times taller than a bar for 92. See bar graph best practices for a side-by-side example.
- Uneven bar widths or gaps. Different widths make some bars look more important than others.
- No units or title. A graph should stand on its own without the surrounding text.
- Too many categories. Past about a dozen bars, readers stop comparing. Combine small ones into “Other”.
- Using bars for continuous data. Ages, heights and scores split into ranges belong in a histogram.
- Decoration. 3D effects and patterns behind the bars make lengths harder to judge.
Checklist before you share it
- The value axis starts at zero, with even steps.
- Every bar has the same width.
- The title says what the chart shows, and there is a source.
- Both axes have titles, and the value axis states the unit.
- Bars are sorted (largest to smallest), unless the categories have a natural order.
- You could read it in five seconds.
Frequently asked questions
Should the bars in a bar graph touch?
No. A bar graph has gaps between bars because each bar is a separate category. Bars that touch are a histogram, which shows one continuous number split into ranges. A gap of about a third to a half of a bar’s width is a common, readable choice.
Should I use a vertical or a horizontal bar graph?
Use vertical bars for short labels and for sequences such as months. Use horizontal bars when labels are long or when you are ranking many items. The types of bar graphs guide compares them.
How many bars is too many?
Around ten to twelve is comfortable. Beyond that, group the smallest categories into “Other”, show only the top ten, or split the data across two charts.
How do I compare two groups?
Put the two groups’ bars side by side in a grouped bar graph, also called a double bar graph.
Unfamiliar term? See the chart and graph glossary, or browse the examples gallery.
Spotted an error or something unclear? Tell us and we will fix it. Sources for factual claims are linked in the text. We say so on the page when something is a rule of thumb rather than a standard.