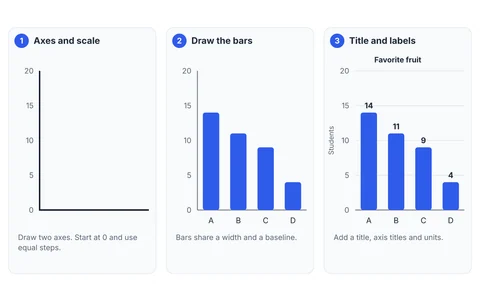
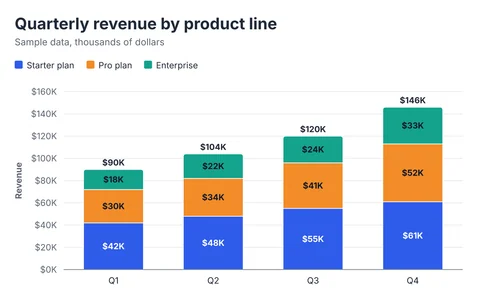
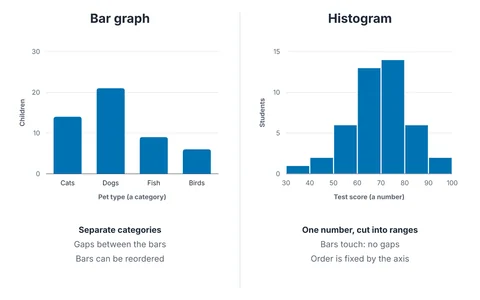
Quick answer: a good bar graph starts its axis at zero, sorts its bars (unless the categories have a natural order), keeps to a dozen or fewer bars, uses one color unless color carries meaning, labels the unit and the source, and can be understood without extra explanation. The ten rules below explain each one and why it matters.
1. Start the value axis at zero
In a bar graph, the length of the bar is the data. If the axis starts above zero, you cut off the bottom of every bar, and lengths stop being proportional to values. A 3% difference can look like a 150% one.
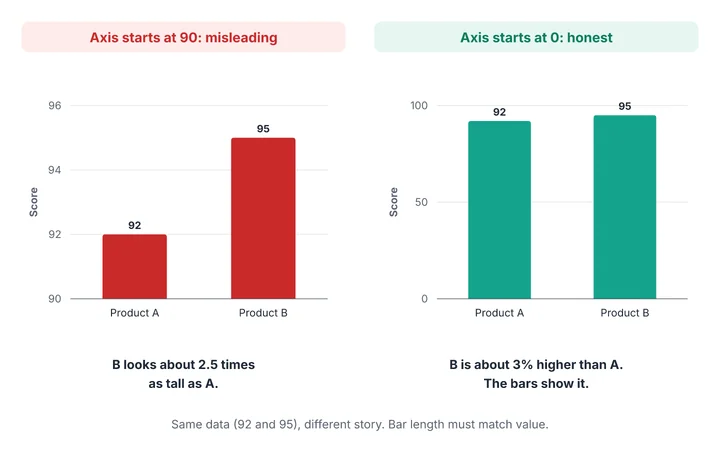
If you genuinely need to zoom in on small differences, use a line graph, where position rather than length carries the value, and say that the axis is cropped. Our editor warns you if you set a non-zero minimum on a bar graph.
2. Sort the bars
Unless the categories have a natural order (months, ages, survey scales from “disagree” to “agree”), sort from largest to smallest. Readers then see the ranking at once and can find a category faster. Sorting is one click in the horizontal bar graph maker, which opens sorted.
3. Choose the orientation for your labels
Use vertical bars for short labels and sequences. Use horizontal bars for long labels: text written sideways or at an angle is harder to read than text on a straight line. See types of bar graphs.
4. Keep the number of bars manageable
Around ten to twelve bars is comfortable. Beyond that, the reader is scanning, not comparing. Show the top ten and group the rest as “Other”, or split the data across two charts.
5. Use one color unless color means something
Rainbow bars imply a meaning that is not there. Use one color for all bars, and a contrasting color for the one bar you are talking about. When color does carry meaning, such as different series in a grouped chart, keep it consistent across every chart in the document.
6. Make colors work for everyone
About 1 in 12 men and 1 in 200 women have some form of color-vision deficiency, according to Colour Blind Awareness, so do not rely on color alone. Use a palette designed to stay distinguishable, such as the Okabe–Ito palette, which is built into the editor as “Color-blind safe”. If the chart may be printed in black and white, turn on hatch patterns. Check that text and important graphics meet the WCAG contrast guidance of at least 3:1 for graphical objects.
7. Label directly and say what is measured
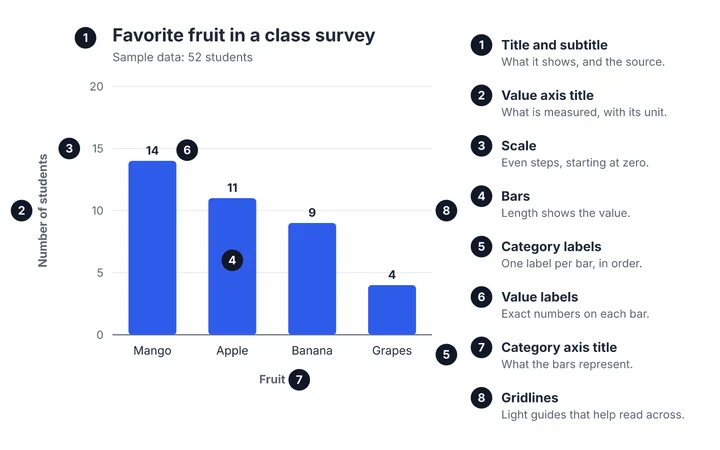
- Title: say what the chart shows, ideally what to notice (“Mango is the most popular fruit”).
- Axis titles: name the category and the measure, with units (“Revenue, $ thousands”).
- Value labels: add them when readers need exact numbers; leave them off when gridlines are enough.
- Source: put it in the subtitle or a caption, with the date of the data.
8. Make the bars wider than the gaps
Bars that are too thin look like lines and lose their visual weight, while gaps that are too small make separate categories look like one block. A gap of about a third to a half of a bar’s width is a readable default. In the editor, use Space between categories in the Design tab.
9. Skip 3D, shadows and decoration
Depth makes bar heights hard to judge, and textures behind bars compete with the data. Decoration should never change how a value looks. Cleveland and McGill’s classic experiments on graphical perception (Journal of the American Statistical Association, 1984) found that people judge position along a common scale more accurately than angle or area, which is why plain bars on a shared baseline work so well.
10. Add alt text and a data table
Describe the chart for people who cannot see it: what it shows, the highest and lowest values, and the trend or takeaway. The Export tab generates a plain-language description from your data that you can paste into the image’s alt field. For anything important, also provide the data as a table. The W3C guidance on complex images explains when to use a longer description.
A quick pre-flight checklist
- Does the value axis start at zero?
- Are the bars sorted sensibly?
- Is there a title, axis titles with units, and a source?
- Is color used for meaning, not decoration?
- Could someone who is color blind read it?
- Does it have alt text?
- Could a stranger understand it in five seconds?
Ready to apply them? Open the bar graph maker, or see the examples gallery for charts that follow these rules.
Frequently asked questions
Can a bar graph ever start at a non-zero value?
It can, but it should not, because bar length then misrepresents the values. If you need to show small differences among large numbers, a line graph or a dot plot is more honest. If you must crop a bar axis, label it clearly.
How many colors are too many?
More than five or six distinct colors are hard to tell apart and hard to remember. If you have that many categories, use one color and label the bars directly.
Should I use gridlines?
Light gridlines help readers read across to the scale. Use them when there are no value labels. If every bar is labeled, you can remove them for a cleaner look.
Unfamiliar term? See the chart and graph glossary, or browse the examples gallery.
Spotted an error or something unclear? Tell us and we will fix it. Sources for factual claims are linked in the text. We say so on the page when something is a rule of thumb rather than a standard.