Stacked Bar Chart Maker
Build a stacked or 100% stacked bar chart with totals and segment labels. Free, no account needed.
- Free, no account
- No watermark
- Stacked and 100% in one click
- Data stays in your browser
| Label | ||||
|---|---|---|---|---|
Tip: click the first cell and paste rows from Excel or Google Sheets. Press Enter to move down.
Import from a spreadsheet or CSV
Accepts .csv, .tsv or .txt files up to 3 MB, with up to 200 rows and 12 series. The first column is used for labels; every other column becomes a series. Excel files (.xlsx) are not read directly: save as CSV first. Files are read in your browser and never uploaded.
How to use the stacked bar chart maker
- Enter one column per part. Put your categories (quarters, regions, months) in the Label column, then add a series column for each part of the total, such as product lines.
- Choose Stacked or 100%. The example opens as a stacked chart. Under Design › Bar layout, “100%” rescales every stack to the same height so you can compare proportions.
- Order your series deliberately. The first series sits at the bottom. Put the part you want readers to compare most at the bottom, where it shares a baseline.
- Add labels and a legend. Segment values and the stack total are shown when there is room. Keep the legend on top so readers can map colors to parts.
- Export. Download a PNG or SVG. Use hatch patterns if the chart may be printed in black and white.
What you get
- Stacked, 100% and groupedSwitch layout without retyping. The same table drives all three.
- Totals on topIn a stacked chart the total for each stack is written above it (for stacks with no negative values).
- Labels only where they fitA segment value is drawn only if it fits inside the segment, so small pieces stay clean instead of collapsing into overlapping text.
- Negative values supportedPositive parts stack above zero and negative parts below it, so a chart with losses still reads correctly.
- Custom or patterned colorsPick a palette, set each series color yourself, or use hatch patterns for grayscale printing.
- Horizontal stacksSwitch Direction to Horizontal for long category names.
- Alt text and CSVAlt text is generated from your data, and the data can be downloaded as CSV.
Examples: data in, chart out
These charts were made with this tool from the sample data described under each one. Open any of them in the editor to see the exact numbers and settings, or browse the full examples gallery.
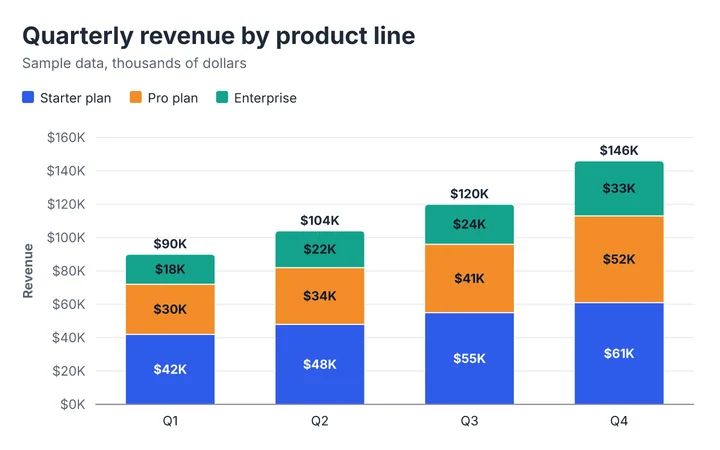
Input: revenue for three plans across four quarters (sample data, $ thousands). Settings: stacked, dollar prefix and K suffix. The total above each stack shows growth; the colors show which plan drove it.
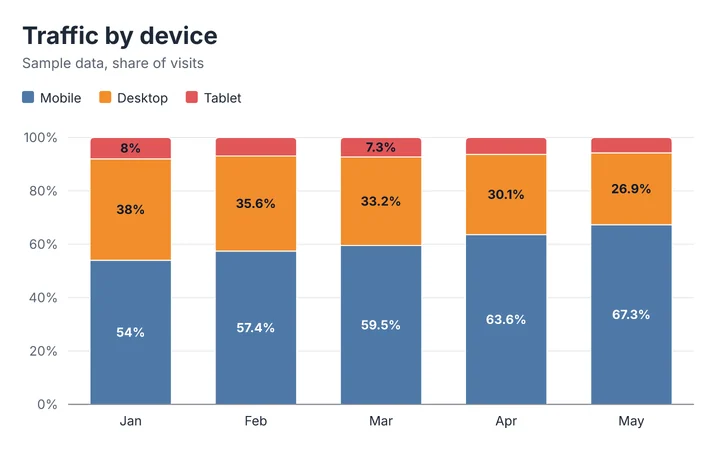
Input: visits by device over five months. Settings: 100%. Every stack is the same height, so the change in the mobile share is easy to see even though the total changes.
How this stacked bar chart works
Stacked bars add each series’ value on top of the one before it, starting from zero.
- Stacks are built in series order, first series at the base. Positive values stack upward from zero and negative values stack downward from zero, separately.
- In 100% mode each value is divided by its category’s total (the sum of the absolute values) and drawn as a share of 100. Segment labels show the percentage, not the raw value.
- The value axis in stacked mode runs from the most negative stack to the tallest positive stack. A reference line, if you add one, uses the mean of the category totals.
- Sorting a stacked chart orders categories by their total.
Limits you should know about
- Only the bottom segment shares a baseline, so it is the only one readers can compare precisely. If you need to compare every part, use a grouped bar chart.
- A stack that contains a negative value gets no total label, because “total” would then be ambiguous.
- Up to 12 series and 200 rows. Beyond five or six segments, stacks are hard to read.
- Empty cells count as missing, not zero.
What happens to your data
The chart is drawn in your browser. Your data is autosaved to local storage on this device only; nothing is uploaded. See the privacy notes.
Method last reviewed September 30, 2026. See how we build and check our tools.
When to use it
Revenue or cost breakdowns
Show a total and what it is made of, quarter by quarter.
Survey responses
Agree / neutral / disagree per group. Use 100% so groups of different sizes are comparable.
Budget vs actual by department
One stack per department with a segment per cost type.
Traffic by device or channel
Track how the mix shifts over months with the 100% layout.
Composition of a single total
One total split into parts? A <a href="/pie-chart-maker/">pie chart</a> may be enough.
Comparing series directly
Use grouped bars when each series matters on its own.
Tips and common mistakes
- Limit yourself to five segmentsMore than that and neighboring colors blur together. Merge small parts into “Other”.
- Choose colors with clear stepsAdjacent segments need contrast. The color-blind-safe palette is a good default.
- Put the key series on the bottomIt is the only one that starts at zero for every stack.
- Use 100% when totals differIf the totals are not the story, proportions read better than heights.
- State the unitSay whether values are dollars, units or people in the axis title; in 100% mode say “Share of visits” or similar.
- Do not stack unrelated thingsThe stack implies the parts add up to a meaningful total. If they do not, use grouped bars.
Frequently asked questions
What is a stacked bar chart?
A stacked bar chart splits each bar into segments, one per series, so you can see both the total and its parts. The segments are stacked end to end, starting at zero.
What is a 100% stacked bar chart?
A 100% stacked bar chart scales every bar to the same full height and shows each part as a share. Use it to compare proportions between categories when their totals differ.
How do I make a stacked bar chart?
Put your categories in the first column and add one column per part. This page opens in stacked mode. From another tool, open Design › Bar layout › Multiple series and choose Stacked.
How do I show totals on a stacked bar chart?
Turn on “Show value labels”. The total for each stack appears above it, unless that stack contains a negative value.
How do I change the stacking order?
The first series in your table is at the bottom. Reorder your columns by editing the series names and values, or by pasting them in the order you want.
Why is a small segment missing its label?
A label is drawn only when it fits inside its segment. Make the canvas larger, reduce Text size, or read the value from the table or the alt text.
Can I stack horizontally?
Yes. Choose Direction › Horizontal in the Design tab. It works well for long category names.
Related chart tools
Grouped Bar Chart Maker
Compare two or more series side by side: double and clustered bar graphs.
Open the tool →
Bar Graph Maker
Vertical, horizontal, grouped and stacked bar graphs from your own data.
Open the tool →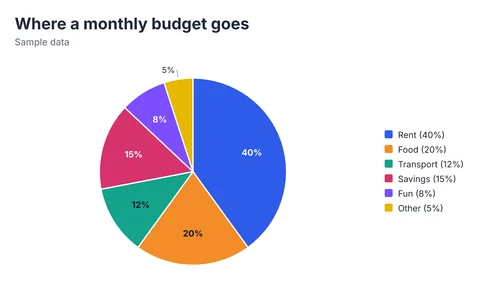
Pie Chart Maker
Pie and donut charts with percent labels and a values legend.
Open the tool →Guides that go with this tool
- Types of Bar Graphs and When to Use EachVertical, horizontal, grouped, stacked and 100% stacked bar graphs explained with examples, what each is best for, and the mistakes to avoid.
- Bar Chart vs Pie Chart: Which One Should You Use?When to use a pie chart and when a bar chart is clearer: the same data drawn both ways, why bars are easier to read, and simple rules for choosing.