Grouped Bar Chart Maker
Make a grouped (clustered or double) bar graph to compare series side by side. Free, no account needed.
- Free, no account
- No watermark
- Color-blind-safe default
- Data stays in your browser
| Label | |||
|---|---|---|---|
Tip: click the first cell and paste rows from Excel or Google Sheets. Press Enter to move down.
Import from a spreadsheet or CSV
Accepts .csv, .tsv or .txt files up to 3 MB, with up to 200 rows and 12 series. The first column is used for labels; every other column becomes a series. Excel files (.xlsx) are not read directly: save as CSV first. Files are read in your browser and never uploaded.
How to use the grouped bar chart maker
- Add your categories. These are the groups along the bottom, such as subjects, months or regions. Type them in the Label column.
- Add one column per series. For a double bar graph use exactly two columns, for example “Class A” and “Class B”. Click “+ Add series” for more.
- Name the series. The column headings become the legend. Use short, distinct names such as “Last year” and “This year”.
- Set the axis and labels. Add axis titles with units. If your scale has a natural maximum (such as 100 marks), set the axis maximum to match.
- Download it. Save a PNG, or an SVG for print. The color-blind-safe palette keeps the two series distinguishable for more readers.
What you get
- Double, triple and moreTwo series make a double bar graph; add up to 12 for a wider comparison, though five or fewer is easier to read.
- Color-blind-safe by defaultThe starting palette is Okabe–Ito, chosen so series stay distinguishable across common color-vision differences.
- Print-safeTurn on hatch patterns so the bars can be told apart on a black-and-white printout.
- Control the spacingSet the space between groups and the space between bars inside a group.
- Angled value labelsWhen bars are too narrow for their labels, value labels rotate rather than overlap.
- Switch layoutsChange to stacked or 100% stacked without re-entering data, or to horizontal bars.
- Alt text and CSVGenerated alt text describes the highest and lowest values across all series.
Examples: data in, chart out
These charts were made with this tool from the sample data described under each one. Open any of them in the editor to see the exact numbers and settings, or browse the full examples gallery.
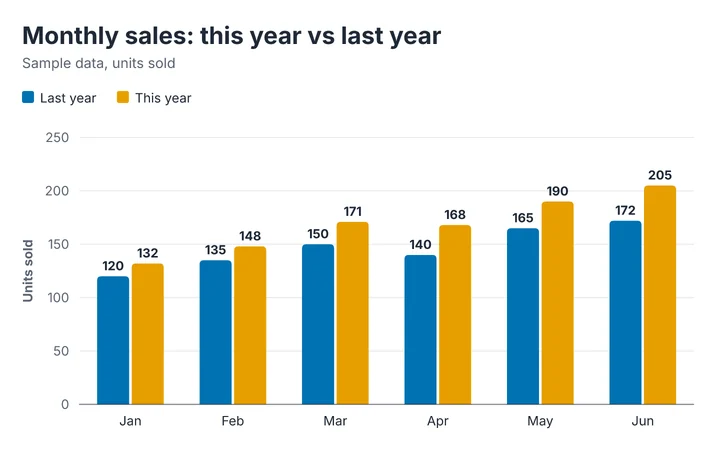
Input: six months of unit sales for two years (sample data). The paired bars make the year-on-year change obvious month by month.
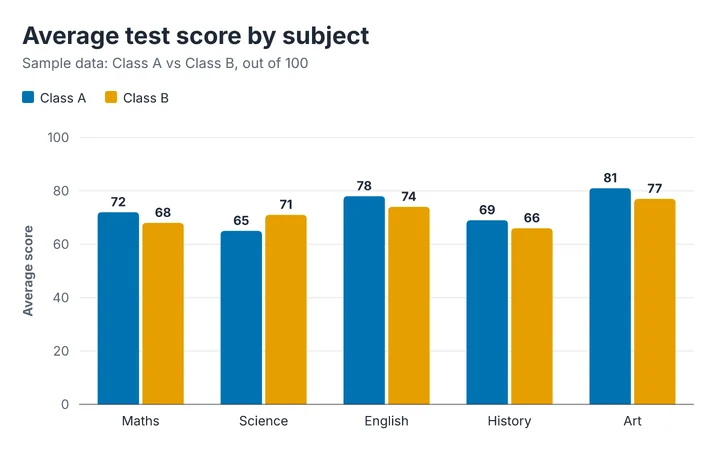
Input: average test scores for two classes in five subjects. Settings: axis maximum fixed at 100 (the top of the marking scale). Shows where each class is stronger.
How this grouped bar chart works
Each category gets a group of bars, one per series, drawn from the same zero baseline so bars can be compared directly.
- Bars in a group share the width of the category band after the gap between groups is removed, then are separated by the inner gap you set.
- Series colors come from the chosen palette in column order. Override any of them under Design › Colors › Custom colors.
- The value axis covers the smallest and largest value across all series, and includes zero.
- If a series has an empty cell, that bar is simply omitted for that category; it is not drawn as zero.
Limits you should know about
- Up to 12 series and 200 rows. The number of bars per group is what limits readability, not the software.
- Group totals are not shown. If the total matters, use a stacked bar chart.
- Value labels can be crowded with many series in a narrow chart. Use a wider canvas, fewer series or turn labels off and rely on the axis.
What happens to your data
Everything is processed in your browser and autosaved to local storage on this device. Nothing you enter is sent to us. See the privacy notes.
Method last reviewed September 30, 2026. See how we build and check our tools.
When to use it
Year-over-year comparison
Two years across the same months or quarters.
Class or group comparison
Average marks or results for two classes, teams or regions.
Before and after
A measurement taken twice, such as pre-test and post-test scores.
Product comparison
Two or three products across the same features or ratings.
Learn to read one
New to double bar graphs? The guide explains how to read them.
When totals matter
Stack the bars instead.
Tips and common mistakes
- Keep to two to four seriesBeyond that a grouped chart turns into a picket fence. Split it into two charts, or use small multiples.
- Keep the series order the same in every groupIt happens automatically here, so readers learn the pattern once.
- Make the legend unambiguousSeries names such as “2023” and “2024” are better than “Series 1” and “Series 2”.
- Start at zeroEspecially here: two bars side by side invite a direct height comparison.
- Match the scale to the data’s meaningIf it is out of 100, set the maximum to 100 so a 72 looks like 72%, not like a nearly full bar.
- Reserve color for the differenceIf one series is the focus, use a strong color for it and a muted one for the other.
Frequently asked questions
What is a grouped bar chart?
A grouped bar chart places two or more bars side by side for each category, one bar per series. It is used to compare series within each category.
What is a double bar graph?
A double bar graph is a grouped bar graph with exactly two series, such as this year and last year. It is the name most often used in schools.
What is the difference between grouped, clustered and multiple bar charts?
They are names for the same thing. “Clustered” is the term used in Excel, “grouped” is common in statistics, and “double” or “multiple” bar graph is common in school maths.
How do I make a double bar graph?
Enter your categories in the first column, then two columns of numbers. This page opens with two series already. Rename the columns for your data and the legend updates automatically.
How many series can I compare?
Up to 12, but comparisons are easiest with two to four. More than that, split the data across charts.
Can I change the colors?
Yes. Pick a palette in Design › Colors, or open Custom colors to set each series individually.
Why did some of my bars disappear?
A bar is omitted when its cell is empty or cannot be read as a number. Cells with unreadable text are outlined in red in the table.
Related chart tools
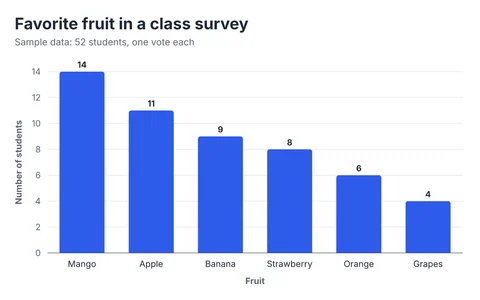
Bar Graph Maker
Vertical, horizontal, grouped and stacked bar graphs from your own data.
Open the tool →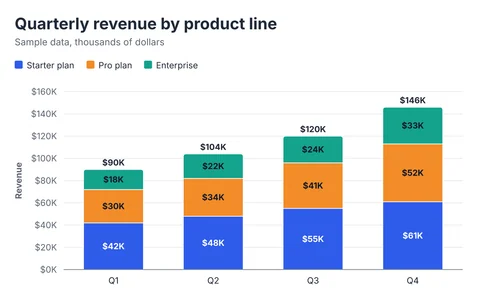
Stacked Bar Chart Maker
Show totals and what they are made of, or switch to 100% proportions.
Open the tool →
Line Graph Maker
One or many lines over time, with optional smoothing and area fill.
Open the tool →Guides that go with this tool
- Types of Bar Graphs and When to Use EachVertical, horizontal, grouped, stacked and 100% stacked bar graphs explained with examples, what each is best for, and the mistakes to avoid.
- How to Read a Bar GraphLearn to read a bar graph in four steps, from the title and axes to the bars, and how to spot a misleading one. Includes a worked example with answers.