Bar Graph Maker
Type or paste numbers, tweak the design, and download a PNG, JPG or SVG. Free, no account, no watermark, and private.
- Free, no account
- No watermark
- Data stays in your browser
- Works on phones
| Label | ||
|---|---|---|
Tip: click the first cell and paste rows from Excel or Google Sheets. Press Enter to move down.
Import from a spreadsheet or CSV
Accepts .csv, .tsv or .txt files up to 3 MB, with up to 200 rows and 12 series. The first column is used for labels; every other column becomes a series. Excel files (.xlsx) are not read directly: save as CSV first. Files are read in your browser and never uploaded.
How to use the bar graph maker
- Enter your data. Type into the table, or click the first cell and paste rows copied from Excel or Google Sheets. The first column holds the labels; every other column is a series of numbers.
- Pick a layout. In the Design tab choose vertical or horizontal bars. With two or more series you can also choose grouped, stacked or 100% stacked.
- Label it clearly. Add a title, axis titles with units, and a source in the subtitle. Turn value labels on if readers need exact numbers.
- Check the chart. Ask whether a stranger could read it in five seconds. The value axis should start at zero, labels should be readable, and colors should be easy to tell apart.
- Download or copy it. Save a PNG for documents and social posts, an SVG for print and slides, or copy the image straight to your clipboard.
What you get
- Every bar layout in one editorVertical, horizontal, grouped (clustered), stacked and 100% stacked, switchable without re-entering data.
- Honest by defaultBars start at zero. If you set a higher minimum, the editor warns you that the chart will exaggerate differences.
- Paste straight from a spreadsheetMulti-row paste fills the table. Header rows, currency symbols, percent signs and thousands separators are understood.
- Color-blind-safe and print-safeChoose the Okabe–Ito palette, or turn on hatch patterns so series stay distinguishable on a black-and-white printout.
- Number formats that fit your readersInternational (1,234,567), Indian (12,34,567) or European (1.234.567,89) grouping, with prefixes, suffixes and compact K/M/L/Cr.
- Alt text written for youA plain-language description is generated from your data, ready to paste into a document or web page for screen-reader users.
- Export up to 3×PNG or JPG at 1×, 2× or 3×, SVG with the font embedded, plus your data as CSV.
- Undo, redo and autosaveYour work is saved in this browser as you go, so a refresh does not lose it.
Examples: data in, chart out
These charts were made with this tool from the sample data described under each one. Open any of them in the editor to see the exact numbers and settings, or browse the full examples gallery.
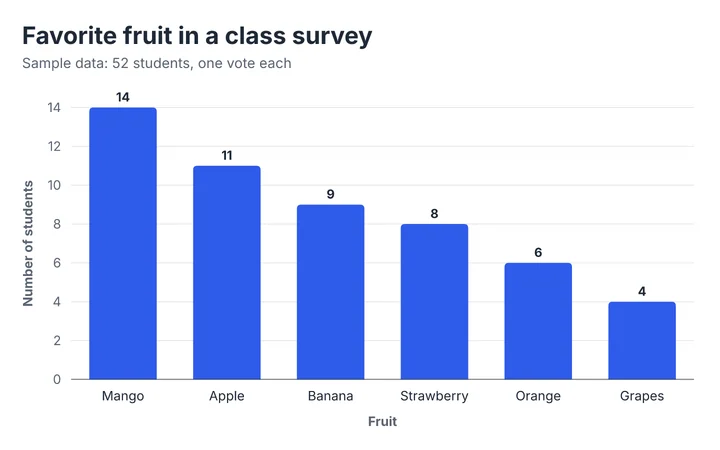
Input: six fruits and the number of students who picked each. Settings: sort largest first, value labels on, one color. The ranking is clear at a glance and every bar starts at zero.
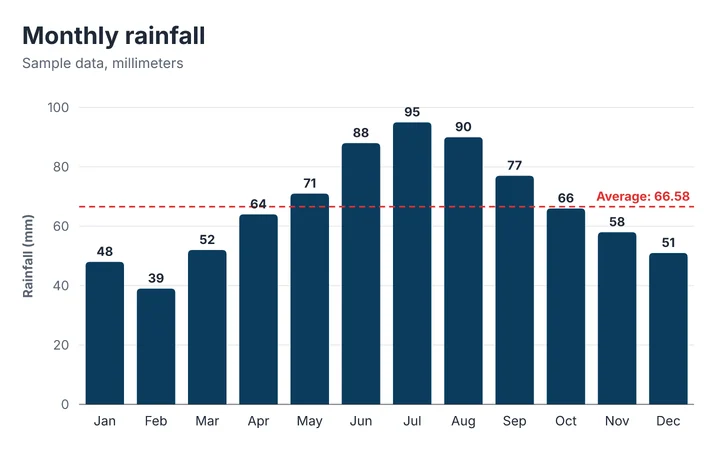
Input: one value per month. Settings: Reference line set to Average, ocean palette, narrower gaps. The dashed line shows which months sit above or below the yearly mean.
How this bar graph maker works
The chart is drawn as SVG in your browser from the table you enter. There is no server step, so results appear as you type.
- The value axis uses steps of 1, 2 or 5 × 10ⁿ so tick labels are round numbers, and it includes zero because a bar’s length is what encodes its value.
- Stacked bars put positive values above zero and negative values below it. 100% stacked bars divide each value by its category’s total (the sum of absolute values).
- Sorting orders categories by the first series, or by the category total for stacked charts. Empty cells are treated as missing, not zero.
- Value labels use the number format you choose; the axis and the labels share the same format so they never disagree.
Limits you should know about
- Up to 200 rows and 12 series. Beyond about 30 bars a chart is hard to read anyway; consider grouping categories.
- No error bars, secondary value axis or log scale. For cumulative percentages, use the Pareto chart maker.
- PNG size is capped by your browser’s canvas limit (about 16 megapixels on iPhone Safari); the export panel tells you if the resolution was reduced. SVG has no such limit.
- The chart is only as good as the data you enter. We do not check your numbers against any source.
What happens to your data
Everything you type stays in your browser. Your work is autosaved to this browser’s local storage so you can come back to it; clear your site data to remove it. A share link stores the chart data inside the link itself, so anyone you give the link to can see it. Read the privacy notes for the full detail.
Method last reviewed September 30, 2026. See how we build and check our tools.
When to use it
School and homework
Survey results, science-fair data and maths class graphs. New to reading them? Start with the guide to reading a bar graph.
Reports and presentations
Monthly sales, budget lines and KPI comparisons. Export SVG for crisp slides or a 2× PNG for documents.
Blogs and social posts
Use the Social share size (1200 × 630) for a chart that fits link previews without cropping.
Comparing two groups
Two years, two products, two classes. Use grouped bars.
Showing parts of a total
Revenue by product line, or share of visits by device. Use stacked bars.
Long category names
Survey answers, job titles or country names read better on a horizontal bar graph.
Tips and common mistakes
- Start at zeroBar length is the message. A truncated axis makes a 5% difference look like a 500% one. Use a line graph if you need a zoomed range.
- Sort unless order mattersRank categories from largest to smallest. Keep the natural order for months, ages and other sequences.
- Use one color unless color means somethingRainbow bars add noise. Highlight one bar in a different color if it is the point.
- Say what and how muchPut the unit in the axis title (“Revenue, $ thousands”) and the source in the subtitle.
- Keep it under about a dozen barsMore than that, and readers stop comparing. Combine small categories into “Other”.
- Avoid 3D and heavy effectsDepth distorts bar heights. This tool does not offer 3D on purpose.
Frequently asked questions
Is this bar graph maker really free?
Yes. It is free to use, and the images you download have no watermark and need no account.
Do I need to sign up or install anything?
No. It runs in your browser on desktop and mobile. There is nothing to install and no login.
Where is my data stored?
Only in your browser. The chart is drawn on your device, and your work is autosaved to local storage on that device. Nothing you type is sent to our servers.
How do I make a bar graph from Excel or Google Sheets data?
Copy the cells (labels in the first column, numbers next to them), click the first cell of the table here and paste. You can also drop a CSV file onto the data panel. The Excel guide walks through both routes.
Can I make a horizontal, stacked or double bar graph?
Yes. Open the Design tab and choose Horizontal, then Grouped, Stacked or 100% for multiple series. A double bar graph is a grouped bar graph with two series. There are also dedicated pages for horizontal, stacked and grouped charts.
Why does my bar graph start at zero and can I change it?
Because bar length represents value, a bar chart that starts above zero exaggerates differences. You can set an axis minimum in the Design tab, but the editor will warn you when you do.
What file formats can I download?
PNG and JPG at 1×, 2× or 3× size, SVG for vector use, and a CSV of your data. You can also copy the chart to the clipboard as an image.
Can I use the charts commercially or in school work?
Yes. The charts you make are yours to use in reports, articles, presentations and coursework. Please still cite the source of your data.
How do I add a title and axis labels?
Open the Design tab, then Titles. Add a chart title, a subtitle for your source, and titles for each axis with units.
More chart tools
Other ways to draw bars, and charts that pair well with bar graphs. All free, all in your browser.
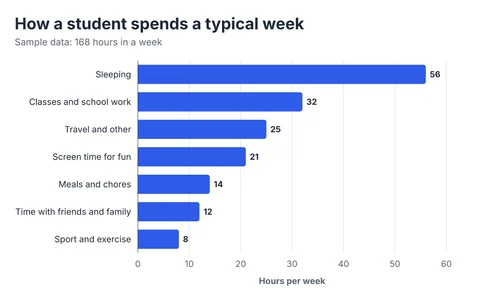
Horizontal Bar Graph Maker
Best for long labels, rankings and survey answers.
Open the tool →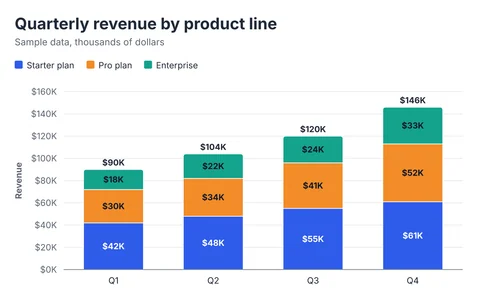
Stacked Bar Chart Maker
Show totals and what they are made of, or switch to 100% proportions.
Open the tool →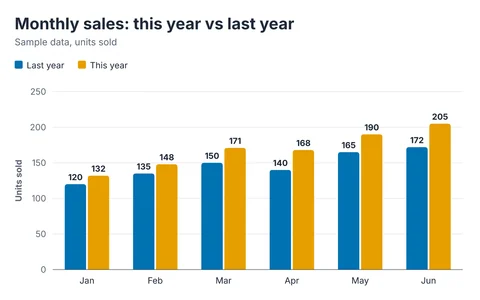
Grouped Bar Chart Maker
Compare two or more series side by side: double and clustered bar graphs.
Open the tool →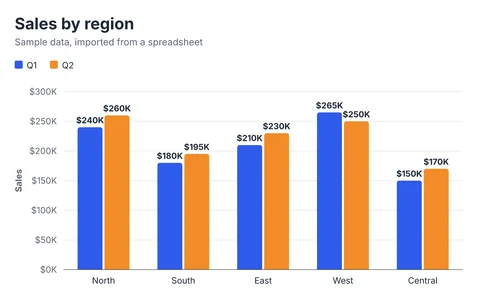
CSV to Bar Chart
Paste from Excel or Google Sheets, or drop a CSV file. Nothing is uploaded.
Open the tool →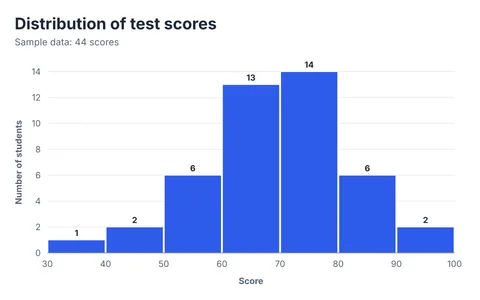
Histogram Maker
Paste raw numbers; get bins, a frequency table and summary statistics.
Open the tool →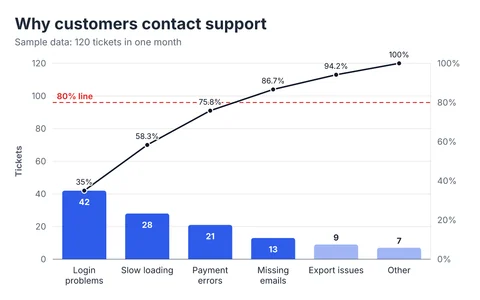
Pareto Chart Maker
Rank causes, add the cumulative line, and find the vital few.
Open the tool →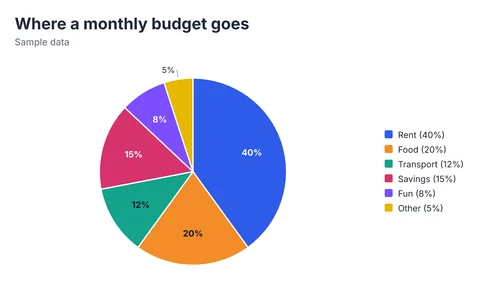
Pie Chart Maker
Pie and donut charts with percent labels and a values legend.
Open the tool →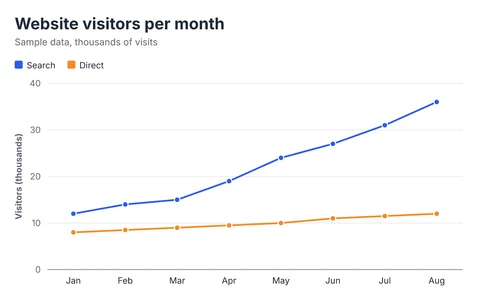
Line Graph Maker
One or many lines over time, with optional smoothing and area fill.
Open the tool →