Pie Chart Maker
Make a pie or donut chart from your numbers. Percentages are worked out and every slice is labeled.
- Free, no account
- Pie and donut
- Percent labels on every slice
- Data stays in your browser
| Slice | ||
|---|---|---|
Tip: click the first cell and paste rows from Excel or Google Sheets. Press Enter to move down. This chart type uses one column of values.
Import from a spreadsheet or CSV
Accepts .csv, .tsv or .txt files up to 3 MB, with up to 200 rows and 12 series. The first column is used for labels; every other column becomes a series. Excel files (.xlsx) are not read directly: save as CSV first. Files are read in your browser and never uploaded.
How to use the pie chart maker
- Enter slices and values. Put each part in the Label column and its number next to it. You can enter counts, amounts or percentages; the tool works out each slice’s share of the total.
- Choose pie or donut. Turn on “Donut” under Design › Pie style for a hollow center that shows the total.
- Keep the slice count low. Five or six is a good maximum. Combine small ones into “Other”.
- Choose colors. Pick a palette, set each slice color under Custom colors, or use patterns for a grayscale printout.
- Download. Save a PNG or SVG. For a share of a single number, consider a horizontal bar graph, which is easier to compare.
What you get
- Pie and donutA donut shows the total in its center.
- Every slice accounted forSlices of 6% or more are labeled inside; smaller slices get an outside label with a leader line. The legend lists every slice with its percentage.
- Works from any numbersUse counts, currency or percentages. Shares are computed from the total.
- Sort or keep your orderSort slices largest first, or keep them in the order you entered.
- Custom colors per sliceSet a color for each slice, choose a palette, or add hatch patterns for black-and-white printing.
- Alt textGenerated text lists the shares from largest to smallest.
- Number formatThe donut total honors your prefix, suffix and digit grouping (international, Indian or European).
Examples: data in, chart out
These charts were made with this tool from the sample data described under each one. Open any of them in the editor to see the exact numbers and settings, or browse the full examples gallery.
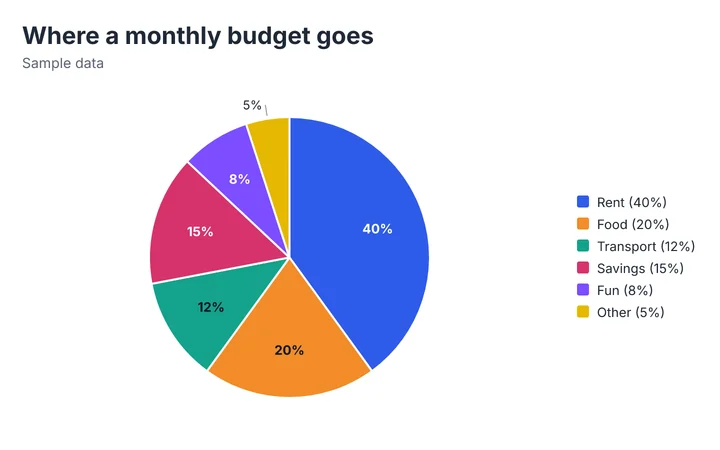
Input: six budget lines that add up to 100 (sample data). The slices are labeled with percentages, and the small “Other” slice is labeled outside with a leader line.
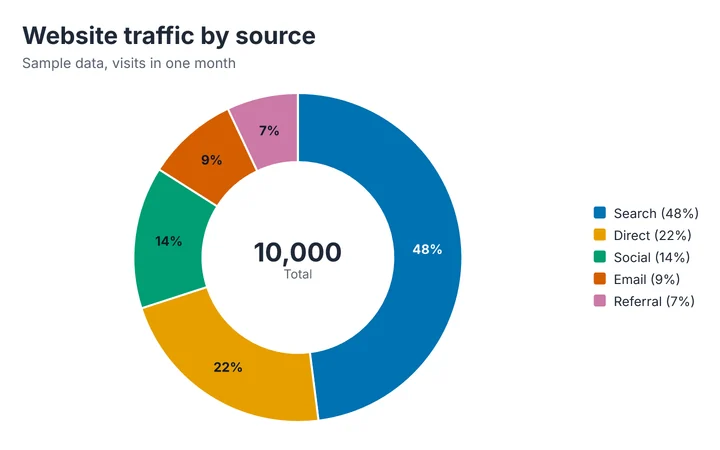
Input: visits by source (sample data, 10,000 in total). Settings: donut, color-blind-safe palette. The total sits in the center and the legend shows each source’s share.
How this pie chart maker works
Each slice’s angle is its value divided by the total, times 360 degrees, starting at 12 o’clock and going clockwise.
- Only the first column of values is used. Zero, empty and negative values are left out because a slice cannot be negative or empty; you will see a note if a negative value is ignored.
- Percentages are rounded to one decimal place in labels, so a set of slices may add up to 99.9% or 100.1% because of rounding.
- Slices of at least 6% get an inside label; smaller slices get an outside label with a leader line. Turn off “Show percentages on slices” to remove them.
- Slices beyond the palette length reuse the palette with lighter tints. Override any color under Custom colors.
Limits you should know about
- Pie charts are hard to compare precisely, especially with similar-sized slices. If precision matters, use a bar graph.
- One series only. To compare several totals, use a 100% stacked bar chart.
- Up to 200 slices technically, though more than about six is rarely readable.
What happens to your data
The chart is drawn locally in your browser and your data is autosaved to local storage on this device. Nothing is uploaded. See the privacy notes.
Method last reviewed September 30, 2026. See how we build and check our tools.
When to use it
Parts of a single whole
Budget splits, market share, time allocation, survey shares that add to 100%.
Simple presentations
One clear message about one whole.
Reports with a few categories
Where the reader needs a rough sense of proportion, not exact values.
Deciding if a pie is right
Our guide compares pie charts and bar charts and says when each works best.
Comparing many shares
Use a bar graph for easier comparison.
Changes over time
Use a line graph or stacked bars, not a row of pies.
Tips and common mistakes
- Use a pie only for parts of a wholeThe slices should add up to something meaningful (100% of visits, the whole budget).
- Five or six slices at mostCombine the rest into “Other” so every slice is readable.
- Sort from largest to smallestStart at 12 o’clock. The eye then reads the ranking clockwise.
- Avoid 3D and exploded slicesThey distort proportions. This tool leaves them out on purpose.
- Label with the number, not just the colorPercent labels save readers a trip to the legend.
- Prefer bars when you need precisionPeople compare lengths more accurately than angles.
Frequently asked questions
How do I make a pie chart?
Enter each slice’s label and value in the table above. The tool draws the pie and works out the percentages. Adjust colors and the title, then download the image.
Do my values need to add up to 100?
No. The chart uses each value’s share of the total, so you can enter counts, amounts or percentages.
How do I make a donut chart?
Open Design › Pie style and turn on “Donut (hollow center)”. The center shows the total.
Why is a value missing from my pie chart?
Slices with zero, empty or negative values are not drawn, because a slice cannot have a negative size. A note appears under the chart when a negative value is left out.
Why do the percentages add up to 99.9% or 100.1%?
Each percentage is rounded to one decimal place for the label. Rounding can make the displayed shares differ slightly from exactly 100.
When should I use a pie chart instead of a bar chart?
Use a pie for a few parts of one whole when a rough sense of proportion is enough. Use a bar chart when you need to compare values precisely or you have many categories. See the comparison guide.
Can I put values inside the slices?
Slices show their percentage, and the legend repeats each percentage next to the slice name. The center of a donut shows the total. Exact values stay in your table and can be downloaded as CSV.
Related chart tools
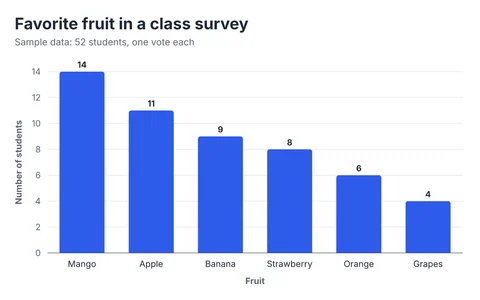
Bar Graph Maker
Vertical, horizontal, grouped and stacked bar graphs from your own data.
Open the tool →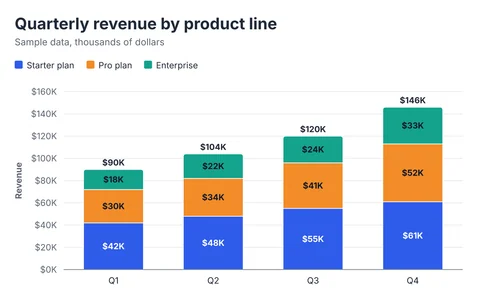
Stacked Bar Chart Maker
Show totals and what they are made of, or switch to 100% proportions.
Open the tool →
Horizontal Bar Graph Maker
Best for long labels, rankings and survey answers.
Open the tool →Guides that go with this tool
- Bar Chart vs Pie Chart: Which One Should You Use?When to use a pie chart and when a bar chart is clearer: the same data drawn both ways, why bars are easier to read, and simple rules for choosing.