Line Graph Maker
Make a line graph with one or more lines, optional smoothing and area fill. Free and phone-friendly.
- Free, no account
- One or many lines
- Gaps stay gaps
- Data stays in your browser
| Label | |||
|---|---|---|---|
Tip: click the first cell and paste rows from Excel or Google Sheets. Press Enter to move down.
Import from a spreadsheet or CSV
Accepts .csv, .tsv or .txt files up to 3 MB, with up to 200 rows and 12 series. The first column is used for labels; every other column becomes a series. Excel files (.xlsx) are not read directly: save as CSV first. Files are read in your browser and never uploaded.
How to use the line graph maker
- Enter your points in order. The Label column is the horizontal axis (months, years, weeks) in the order you want it. Each number column is one line.
- Name each line. The column headings become the legend. Use “Search” and “Direct”, not “Series 1” and “Series 2”.
- Choose the style. Under Design › Line style, turn markers, smoothing and area fill on or off. Leave smoothing off if readers need exact values.
- Add a reference line. Show an average, or a target you type, as a dashed line.
- Download. Save a PNG or SVG. Use the Wide canvas size for a time series with many points.
What you get
- Up to 12 linesCompare several series over the same categories.
- Gaps stay gapsAn empty cell breaks the line. The tool does not guess a value or draw through missing data.
- Smoothing without overshootOptional smooth curves use monotone cubic interpolation, so a curve never dips or peaks above or below your actual points.
- Markers and area fillShow points, fill under each line, or both.
- Reference lineA dashed average or custom target line with a label.
- Sensible axisThe value axis includes zero unless your lowest value is over half your highest, when it zooms in so changes are visible. You can set your own minimum and maximum.
- Alt text and CSVGenerated alt text names the highest and lowest values; your data can be downloaded as CSV.
Examples: data in, chart out
These charts were made with this tool from the sample data described under each one. Open any of them in the editor to see the exact numbers and settings, or browse the full examples gallery.
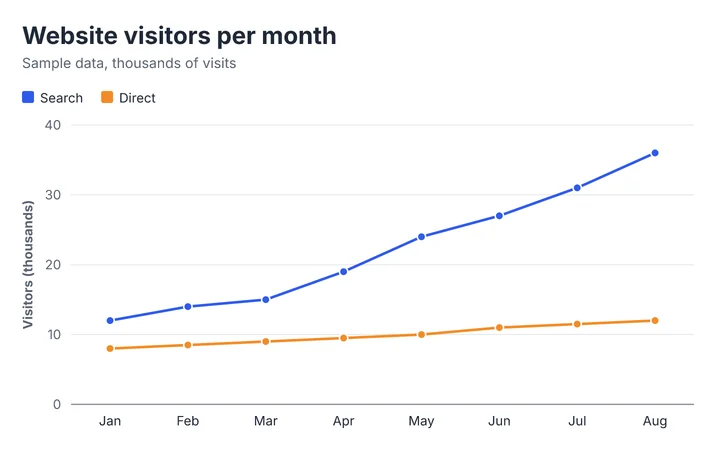
Input: monthly visits from two sources (sample data). Markers on, smoothing off. The lines show that search grew faster than direct visits.
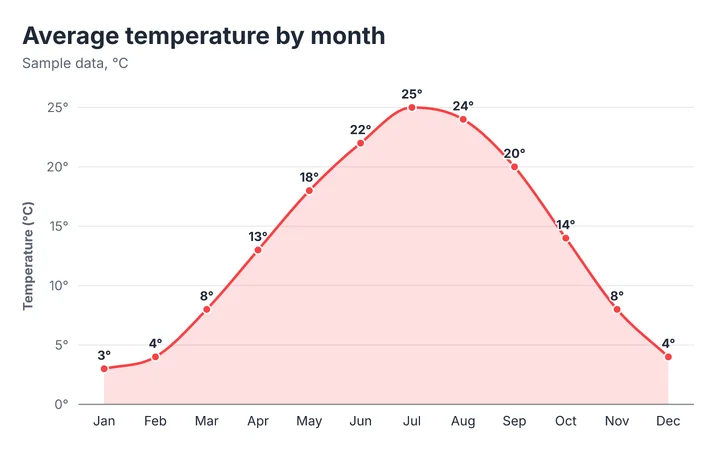
Input: average temperature for twelve months (sample data). Smoothing and area fill on. The curve shows the seasonal rise and fall; the value labels give exact readings.
How this line graph maker works
A line graph connects values in order, so it is best for showing change across a sequence such as time.
- Points are spaced evenly along the horizontal axis, one per row, in the order you entered them.
- A missing value breaks the line into separate segments rather than drawing across the gap.
- Smooth curves use monotone cubic (Fritsch–Carlson) interpolation. It never overshoots your data, but it still changes the visual impression between points.
- The value axis includes zero when all values are non-negative and the lowest is at most half the highest; otherwise it fits the data range. You can override both ends.
Limits you should know about
- Points are evenly spaced, not scaled by date. If your dates are unevenly spaced, the gaps will not be drawn to scale. Enter regular intervals, or fill the gaps with empty rows.
- Text labels only: this is not an XY scatter plot.
- Up to 200 points and 12 lines.
- A smoothed line is an illustration, not data. For exact readings, leave smoothing off.
What happens to your data
The chart is drawn locally and your data is autosaved to local storage on this device. Nothing is uploaded. See the privacy notes.
Method last reviewed September 30, 2026. See how we build and check our tools.
When to use it
Trends over time
Sales by month, temperature by day, visitors by week.
Comparing trends
Two to five lines on the same axis.
Science and lab reports
Measurements taken at regular intervals.
Forecast versus actual
Two lines with an average or target reference line.
Comparing categories, not time?
A bar graph is a better fit.
Line or bar?
Our best-practices guide shows when each works.
Tips and common mistakes
- Use lines for sequences, not categoriesA line implies the points are connected in order. For unordered categories, use bars.
- Keep the number of lines smallMore than four or five and the chart turns into spaghetti. Highlight one and mute the rest.
- Label the unit and the periodSay “Visitors (thousands), per month”.
- Zoom in with careA line chart does not need a zero baseline, but a cropped axis exaggerates change. Mention it if you crop.
- Leave smoothing off for exact dataSmooth curves suggest values between points that you may not have measured.
- Mark the missing dataEmpty cells produce a gap. Say why in the subtitle so readers do not assume an error.
Frequently asked questions
How do I make a line graph?
Enter your labels in order (months, years) in the first column and one column of numbers per line. The tool draws the lines and legend. Adjust the style, then download the image.
Can I add multiple lines?
Yes. Click “+ Add series” under the table. Each column of numbers becomes a line, up to 12.
What happens if I leave a cell empty?
The line breaks at that point. The tool does not join across gaps or invent a value.
Are the points spaced by date?
No, they are evenly spaced, one per row, in the order you enter them. If your dates are irregular, the spacing will not be proportional.
Does a line graph have to start at zero?
Not necessarily. Unlike bars, a line’s position, not its length, carries the value. This tool starts at zero when that is sensible and otherwise fits the range. You can set the minimum yourself.
What does “smooth curves” do?
It draws a curved line through your points with monotone interpolation, which does not overshoot. It is purely visual; turn it off when readers need to read exact values.
How do I add an average or goal line to a line graph?
Open Design › Reference line and choose Average, or Custom value to type a goal. A dashed horizontal line with a label is drawn across the plot.
Related chart tools
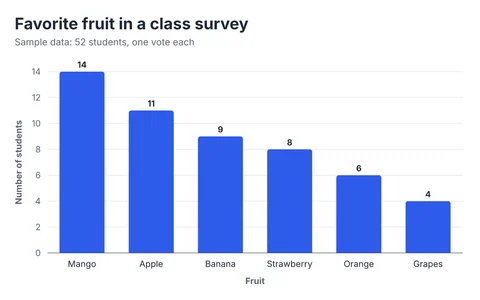
Bar Graph Maker
Vertical, horizontal, grouped and stacked bar graphs from your own data.
Open the tool →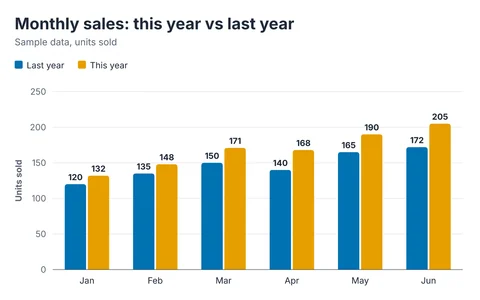
Grouped Bar Chart Maker
Compare two or more series side by side: double and clustered bar graphs.
Open the tool →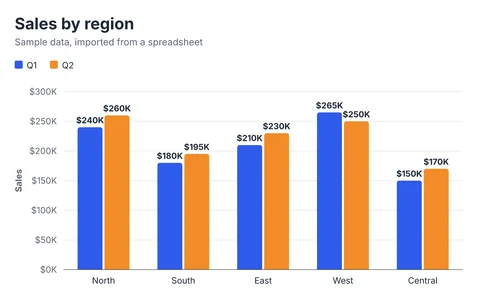
CSV to Bar Chart
Paste from Excel or Google Sheets, or drop a CSV file. Nothing is uploaded.
Open the tool →Guides that go with this tool
- Bar Chart vs Pie Chart: Which One Should You Use?When to use a pie chart and when a bar chart is clearer: the same data drawn both ways, why bars are easier to read, and simple rules for choosing.
- Bar Graph Best Practices: 10 Rules for Clear ChartsTen practical rules for bar graphs that people read correctly: start at zero, sort bars, limit categories, use color carefully, and make charts accessible.