Quick answer: use a pie chart only for a few parts of one whole (about five slices or fewer) when a rough sense of proportion is enough. Use a bar chart when you need to compare values accurately, rank categories, have more than five or six categories, or compare across groups or over time. If you are unsure, choose the bar chart.
The same data, drawn both ways
A monthly budget as a pie chart, and then as a horizontal bar chart:
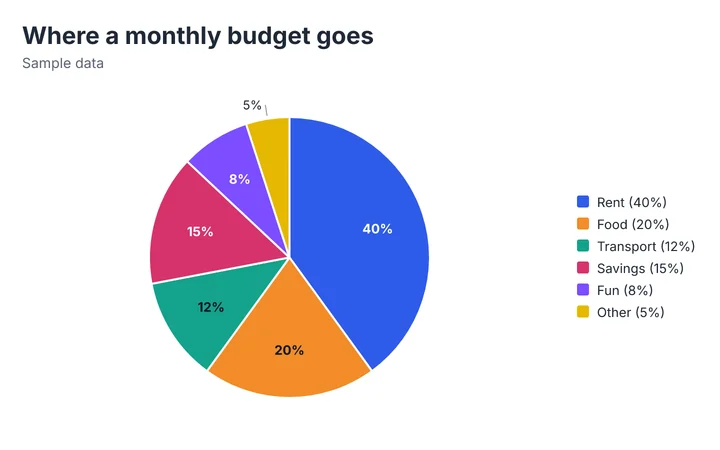
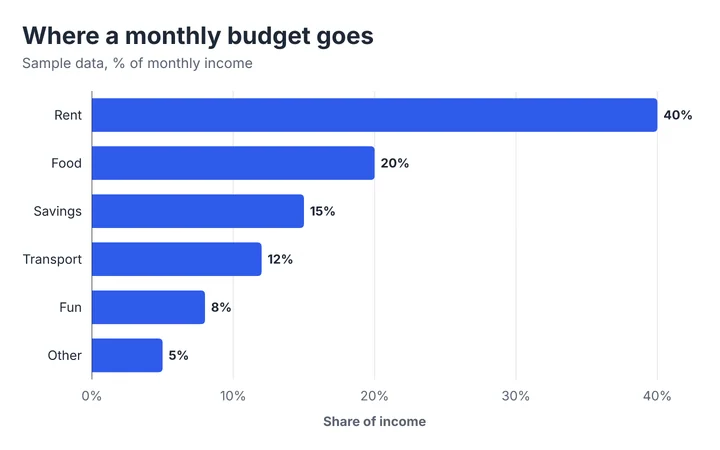
Both charts show the same six numbers. The pie makes “rent is about two-fifths” obvious. The bars make everything else obvious: the order, and how much bigger food is than savings.
When a pie chart works
- The slices are parts of one whole that add up to 100%.
- There are few slices, ideally five or fewer.
- One slice is clearly larger or smaller than the others, and that is your message.
- A rough proportion is enough (“about a quarter”, “more than half”).
- Slices are labeled with their percentages.
When a bar chart is better
- You need to compare values precisely, especially similar ones.
- There are more than five or six categories.
- You want to rank the categories.
- The values do not add up to a meaningful whole (for example, the average score in each of five subjects).
- You are comparing several groups, or the same categories over time.
Why bars are usually easier to read
Readers compare bars by looking at their lengths along a shared baseline. Pie slices must be compared by angle and area, which are harder to judge. In their classic experiments on graphical perception (Cleveland and McGill, 1984), people judged position along a common scale more accurately than angles, and this is the usual reason bar charts are preferred for accurate comparison. Pies still have a place when the point is simply “part of a whole”.
If you use a pie chart
- Limit the slices. Combine small ones into “Other”.
- Sort them from largest to smallest, starting at 12 o’clock and moving clockwise.
- Label with numbers, not only colors. Percentage labels and a legend that lists each share save the reader a trip back and forth.
- Avoid 3D and exploded slices. They distort proportions.
- Do not use a row of pies to show change over time. Use a line graph or a stacked bar chart.
The pie chart maker labels every slice in the legend with its percentage, so even small slices are never a mystery.
What about shares that change over time?
If you want to show how a mix changes, a 100% stacked bar chart puts every bar on the same full height so proportions can be compared across months or groups. The stacked bar chart maker has it built in.
Decision guide
| Your question | Use |
|---|---|
| “What share is each part of a whole?” (few parts) | Pie or donut chart |
| “Which category is biggest, and by how much?” | Bar graph or horizontal bar graph |
| “How does the mix differ between groups?” | 100% stacked bar chart |
| “How does a value change over time?” | Line graph |
| “How are numbers spread out?” | Histogram |
Frequently asked questions
Is a pie chart ever better than a bar chart?
Yes, for a simple message about parts of a whole with very few slices: “Just over half of our visits come from search.” Even then, a single stacked bar or a simple sentence often works equally well.
How many slices is too many?
More than five or six. Slices smaller than about 5% are hard to see and label. Combine them into “Other”.
What is a donut chart?
A donut chart is a pie chart with a hollow center. The center can show the total. It has the same strengths and weaknesses as a pie, and the pie chart maker offers both.
Unfamiliar term? See the chart and graph glossary, or browse the examples gallery.
Spotted an error or something unclear? Tell us and we will fix it. Sources for factual claims are linked in the text. We say so on the page when something is a rule of thumb rather than a standard.