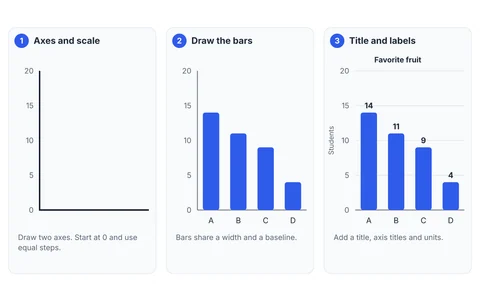
Quick answer: to read a bar graph, (1) read the title and the axis labels to know what is being measured, (2) find the category you care about along the bottom, (3) follow its bar to the top, and (4) read across to the scale to get its value. Then compare the bars: the longest bar is the largest value. Always check that the scale starts at zero.
Step 1: read the title and axis labels
Before looking at the bars, read the title and the labels on both axes. They tell you what is measured (for example “Number of students”) and what the bars stand for (for example “Fruit”). Also look for the unit and the source. A graph without them is easy to misread.
Step 2: find the category
The labels under (or beside) the bars name each category. Find the one you want: in the example below, “Banana”.
Step 3: follow the bar to the top
The top edge of the bar shows its value. A taller bar means a larger value.
Step 4: read across to the scale
From the top of the bar, follow an imaginary line to the scale on the other axis, and read the number. If the top lands between two marks, estimate: halfway between 8 and 10 is about 9.
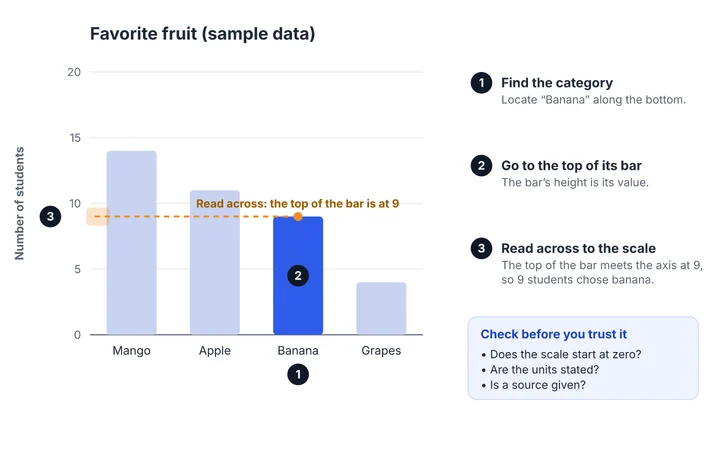
If the bars carry value labels, you can read the exact number directly, but it is still worth checking it against the scale.
Try it: a worked example
Here is the full graph behind the diagram: the favorite fruit of 52 students, each choosing one.
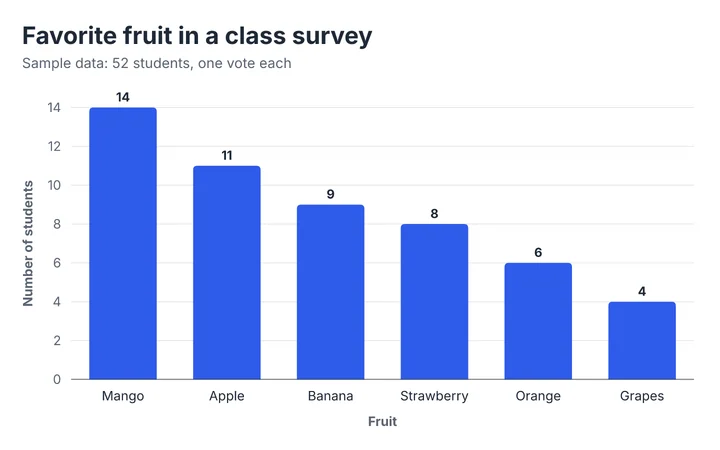
Answer these, then check below.
- Which fruit is most popular?
- How many students chose grapes?
- How many more students chose mango than grapes?
- What is the total number of students who answered?
- How many students chose either apple or banana?
Answers.
- Mango, the longest bar.
- 4 students.
- 14 − 4 = 10 more students.
- 14 + 11 + 9 + 8 + 6 + 4 = 52 students.
- Apple (11) plus banana (9) is 20 students.
Question 4 doubles as a check: if the categories are meant to cover everyone, the bars should add up to the number of people surveyed.
How to compare bars
- Ranking: the longest bar is the largest, the shortest is the smallest.
- Difference: subtract the two values, using the scale or the value labels.
- Ratio: divide one value by the other. Mango (14) is 3.5 times grapes (4), because 14 ÷ 4 = 3.5. This only works when the scale starts at zero.
- Share of the total: divide the value by the total. Mango is 14 ÷ 52, about 27%.
Spotting a misleading bar graph
Ask three questions before trusting a bar graph:
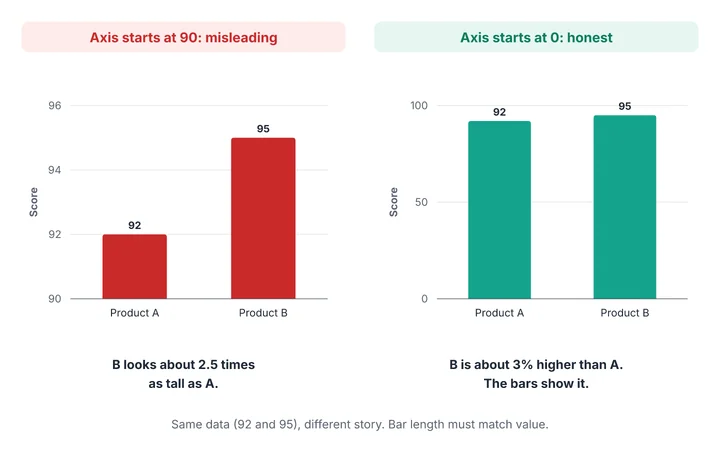
- Does the scale start at zero? If not, differences look bigger than they are.
- Are the steps even? Uneven steps distort the bars.
- Are the units and the source given? Without them you cannot judge the data.
Reading double and stacked bar graphs
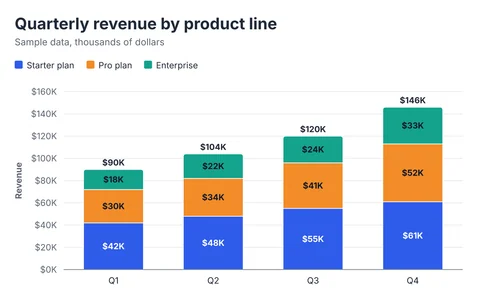
In a grouped (double) bar graph there are two or more bars per category, so check the legend to see which color is which, then compare the bars within each group. In a stacked bar graph each bar is split into colored parts: read the total from the top of the bar, and each part from the length of its segment. Only the bottom segment starts at zero, so compare the other segments carefully. See the types of bar graphs guide for more.
Frequently asked questions
What does the height of a bar tell you?
The height (or length, for horizontal bars) shows the value for that category. Taller means larger.
What if a bar’s top is between two marks on the scale?
Estimate. Halfway between 8 and 10 is about 9. If exact values matter, look for value labels on the bars, or ask for the underlying data.
How is a bar graph different from a histogram?
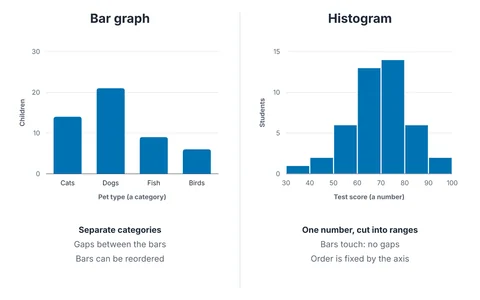
A bar graph compares separate categories and has gaps between bars. A histogram shows how one number is spread across ranges, and its bars touch. See bar graph vs histogram.
Want to make one to practice?
Try the bar graph maker: type in a few numbers and watch the bars move.
Unfamiliar term? See the chart and graph glossary, or browse the examples gallery.
Spotted an error or something unclear? Tell us and we will fix it. Sources for factual claims are linked in the text. We say so on the page when something is a rule of thumb rather than a standard.